Computational Analysis of Digital Communication
Week 1: Introduction
Example: Wealth in Rwanda
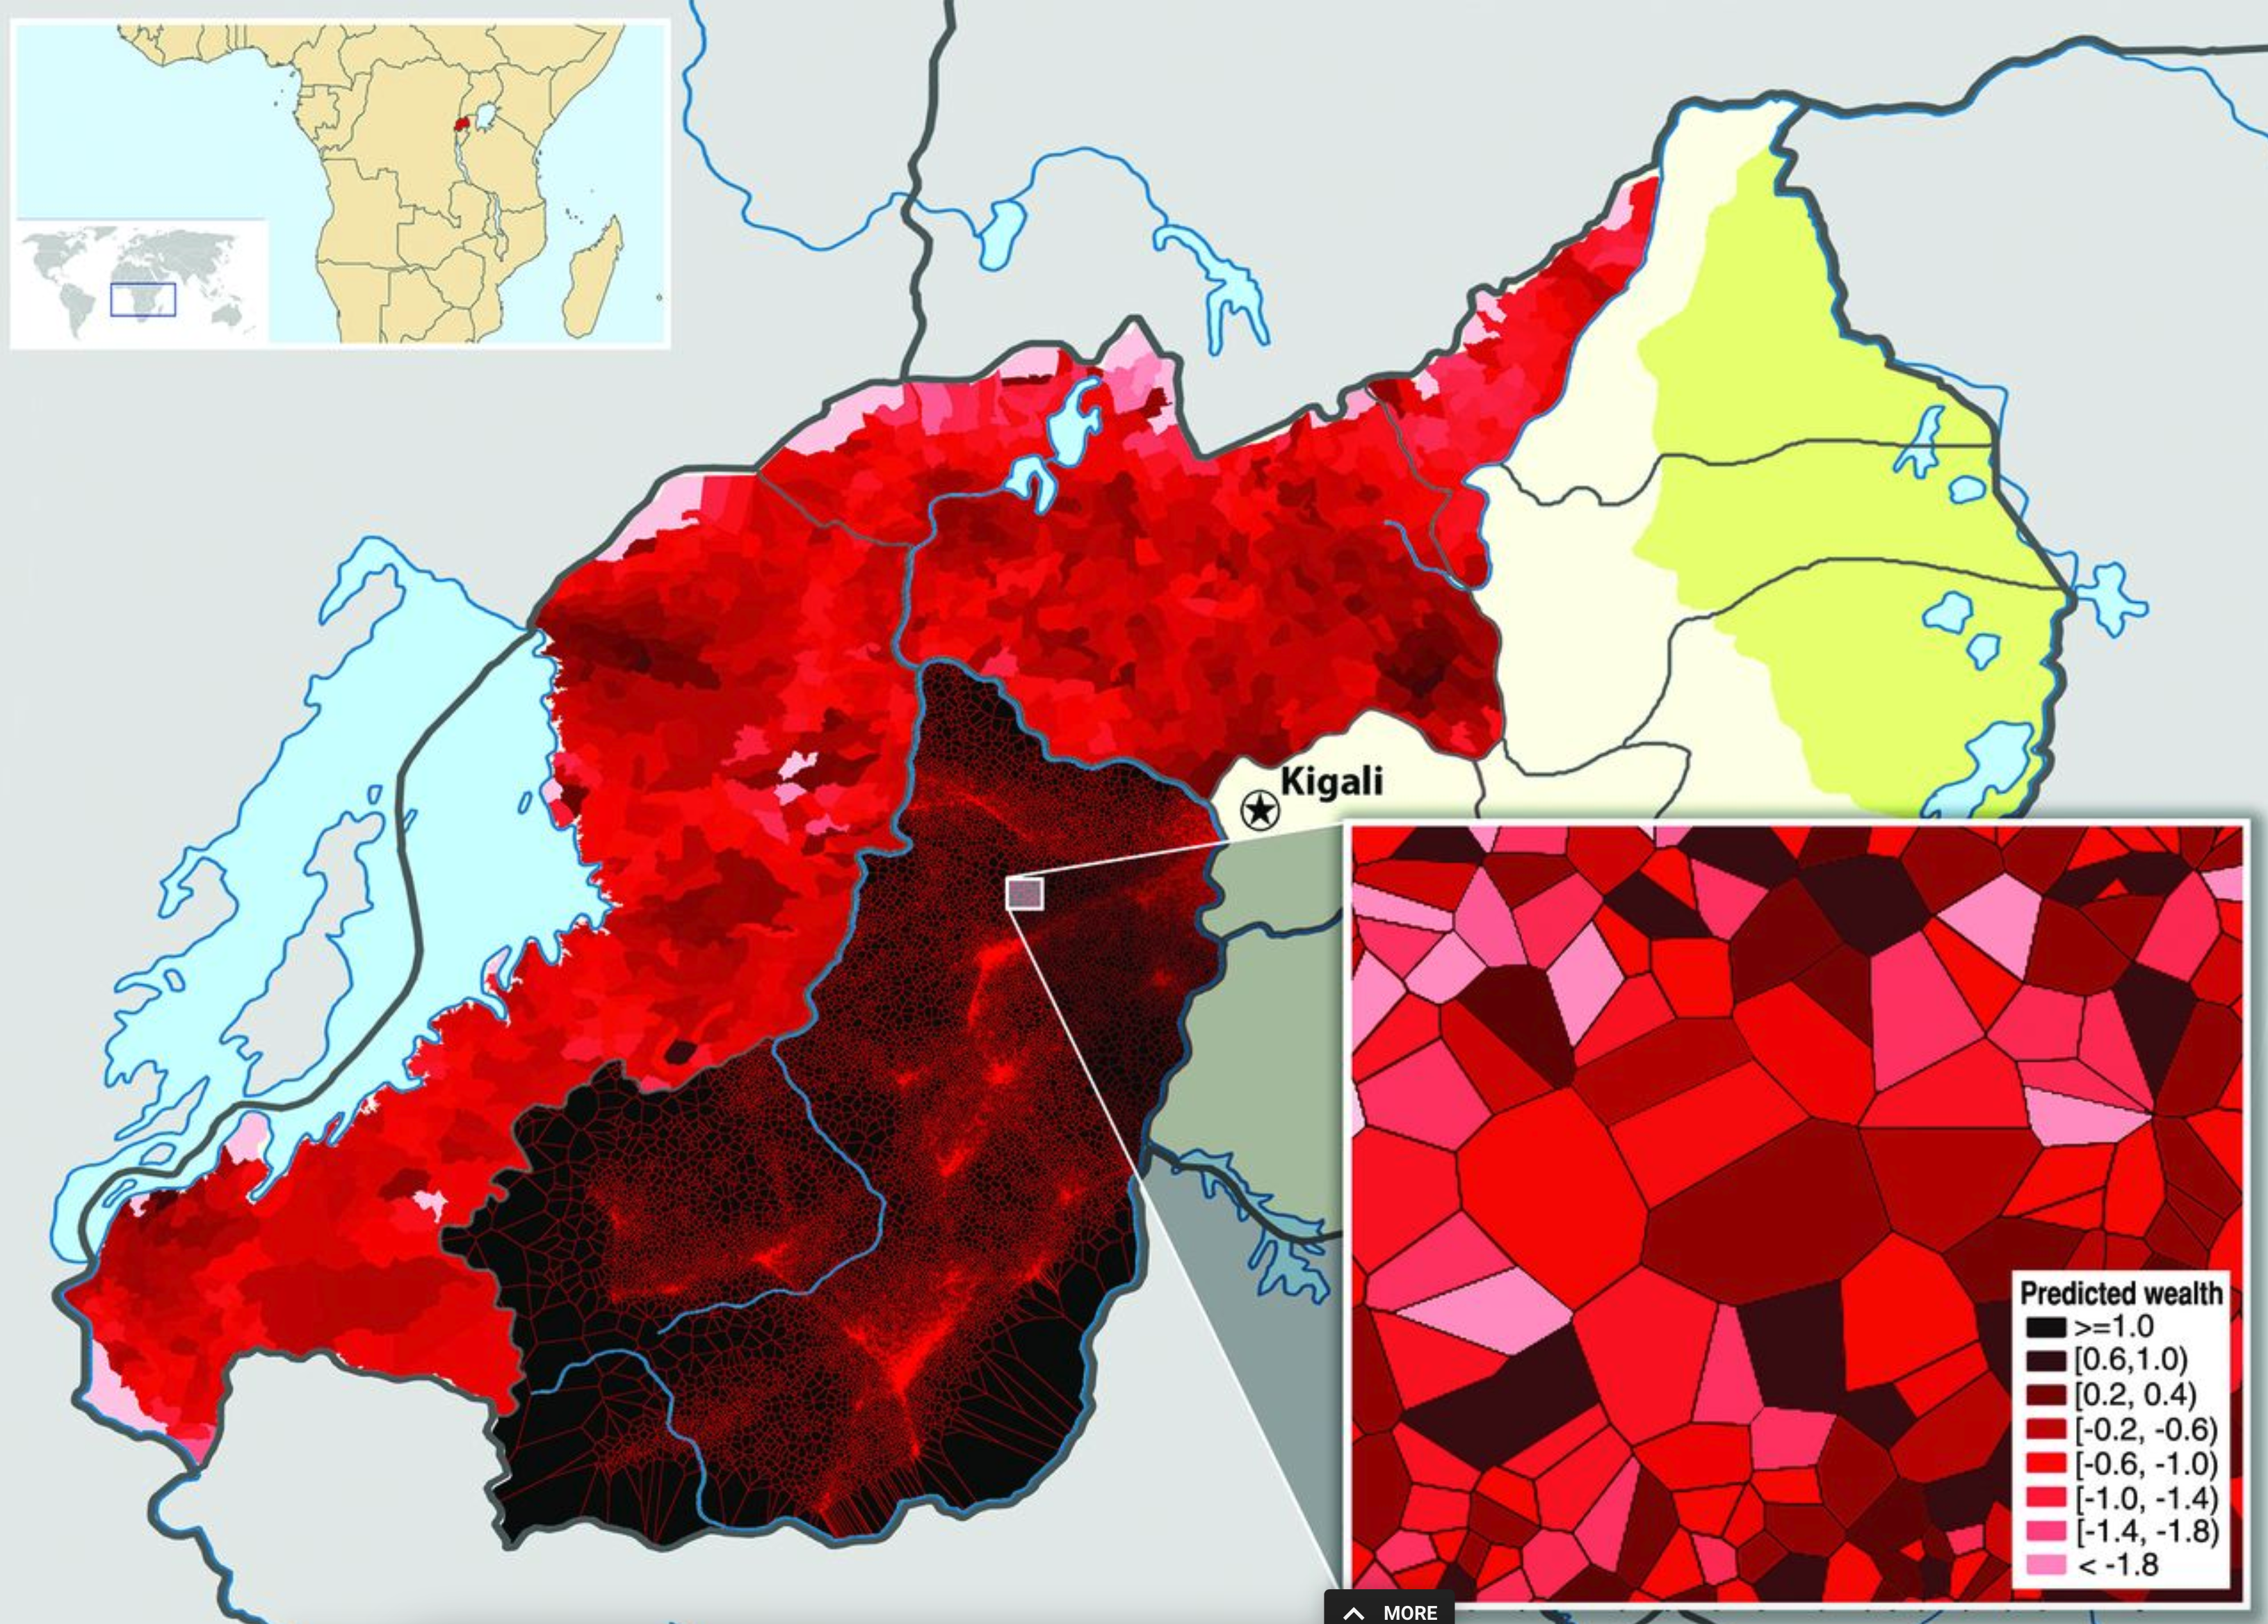
All together, they were able to produce a high-resolution map of the geographic distribution of wealth (and poverty) in Rwanda.
Interesting side effect: Results were hard to validate - there were simply no comparable estimates for all geographic areas in Rwanda
Example: Crime prediction
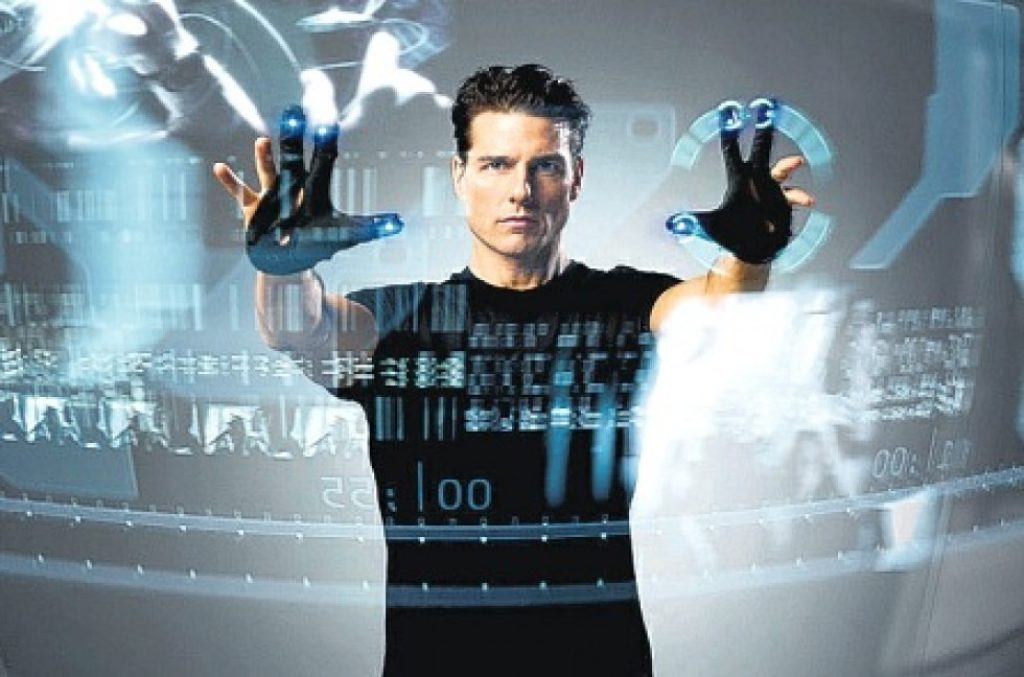
Movie “Minority Report”, 2002
Already years ago, police departments have started to use a system called CRUSH (Criminal Reduction Utilizing Statistical History)
It evaluates patterns of past crime incidents and combines it with a range of data including crime reports, offender behavior profiles, or weather forecasts
This combination of data is then used to predict potential hot spots and allocate resources to areas where particular crimes are most likely to occur.
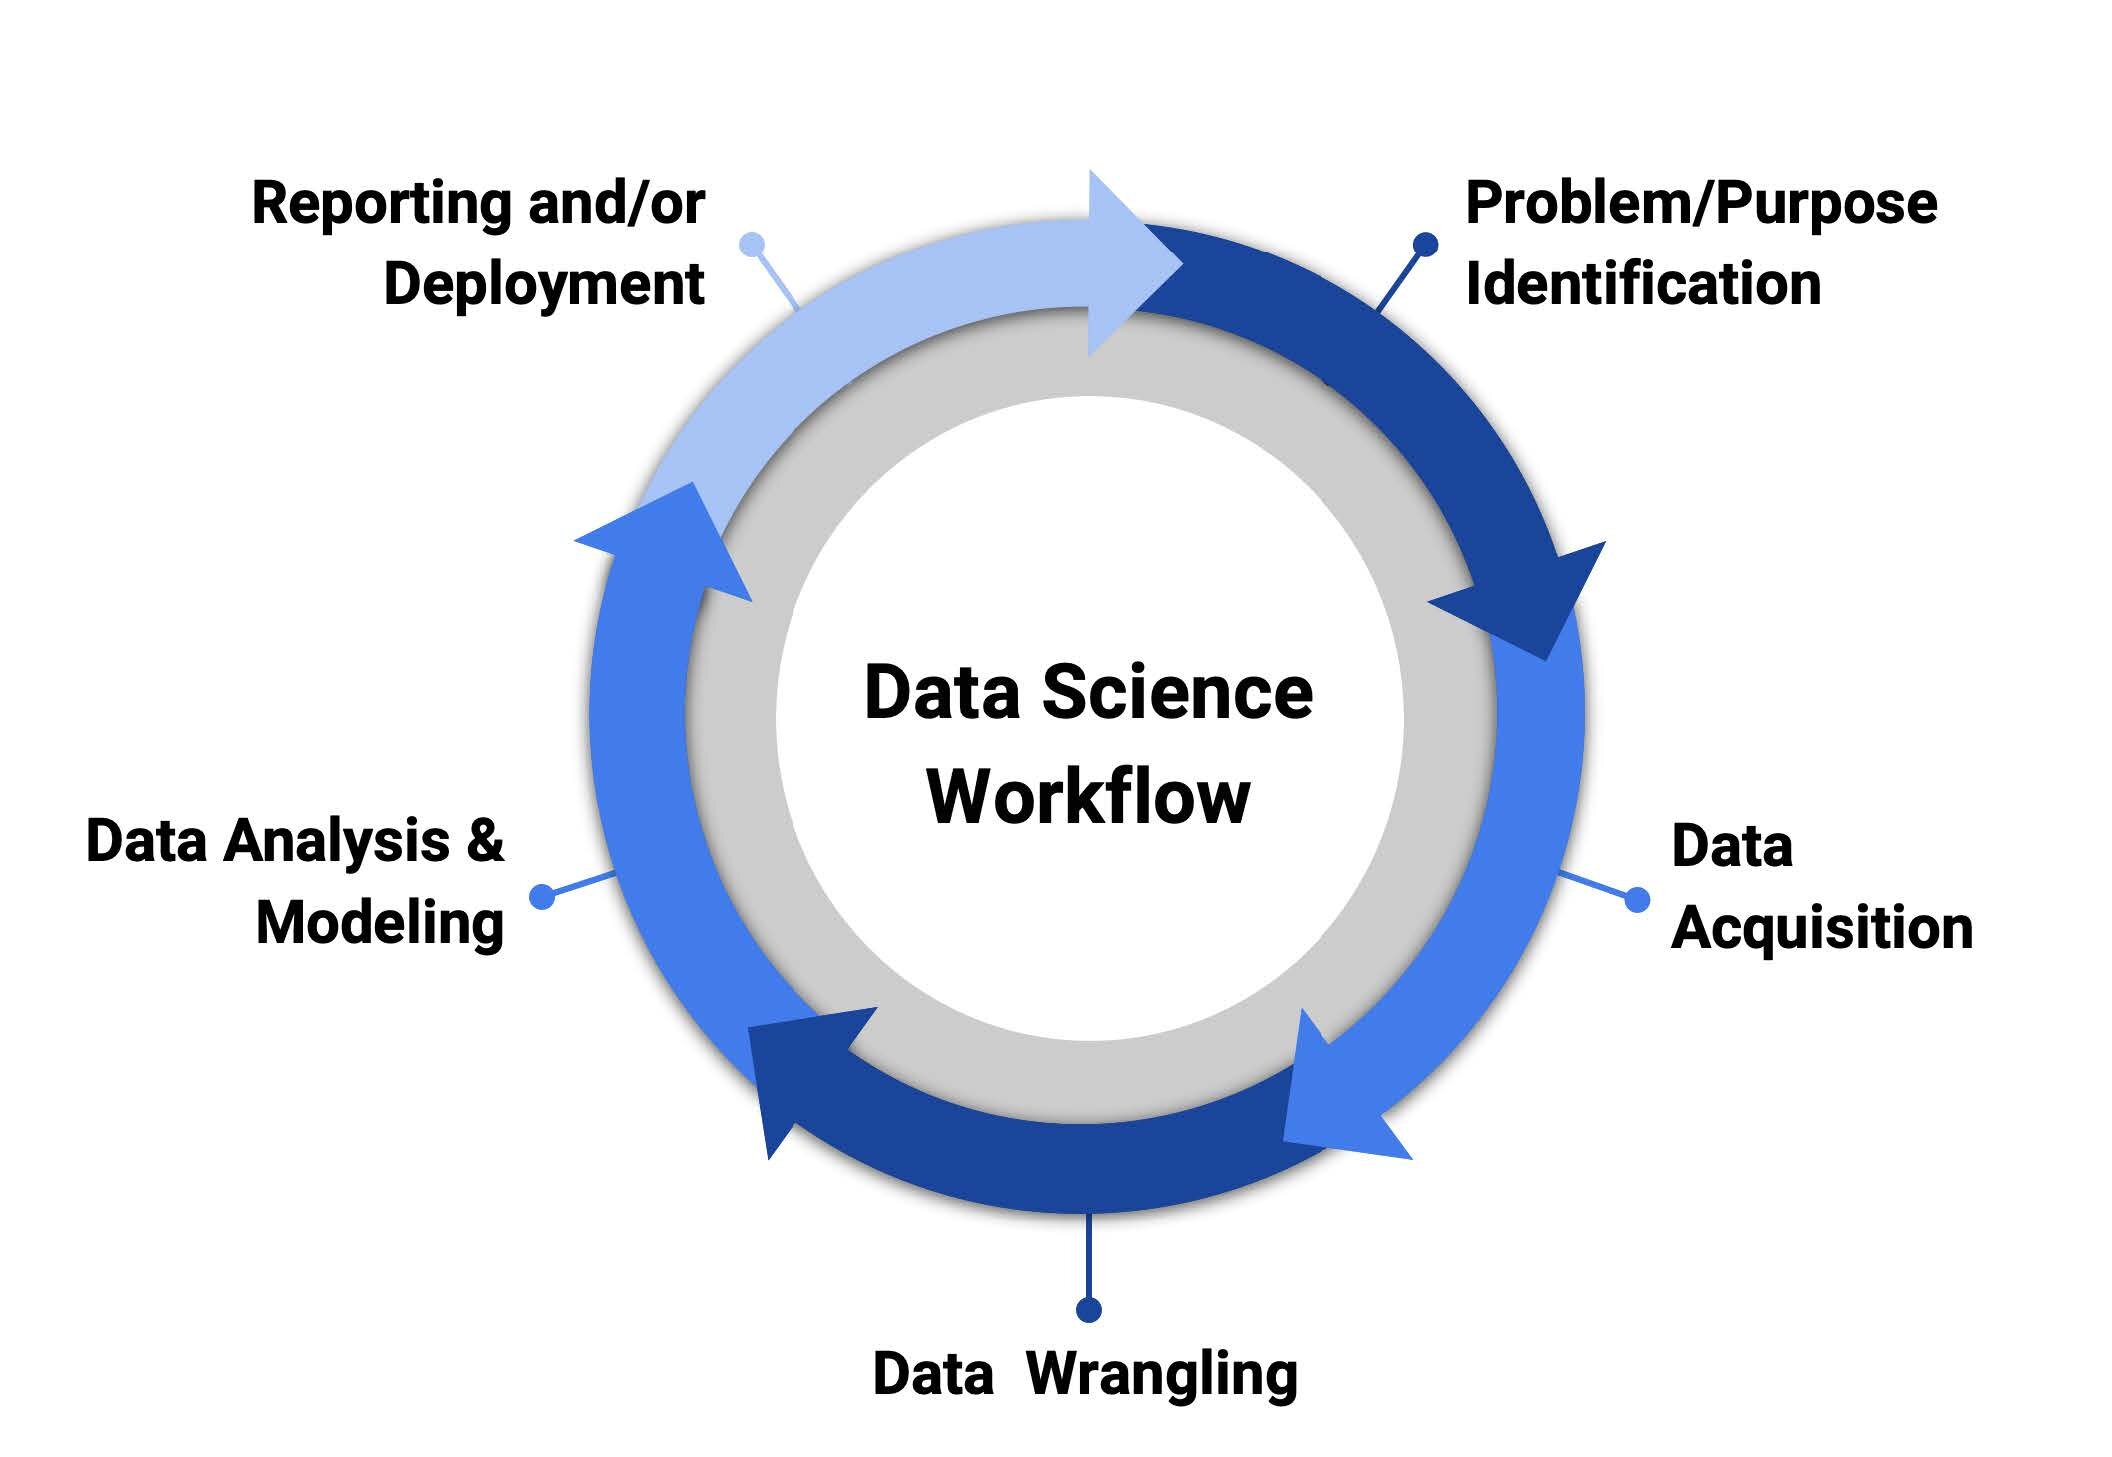
Typical workflow
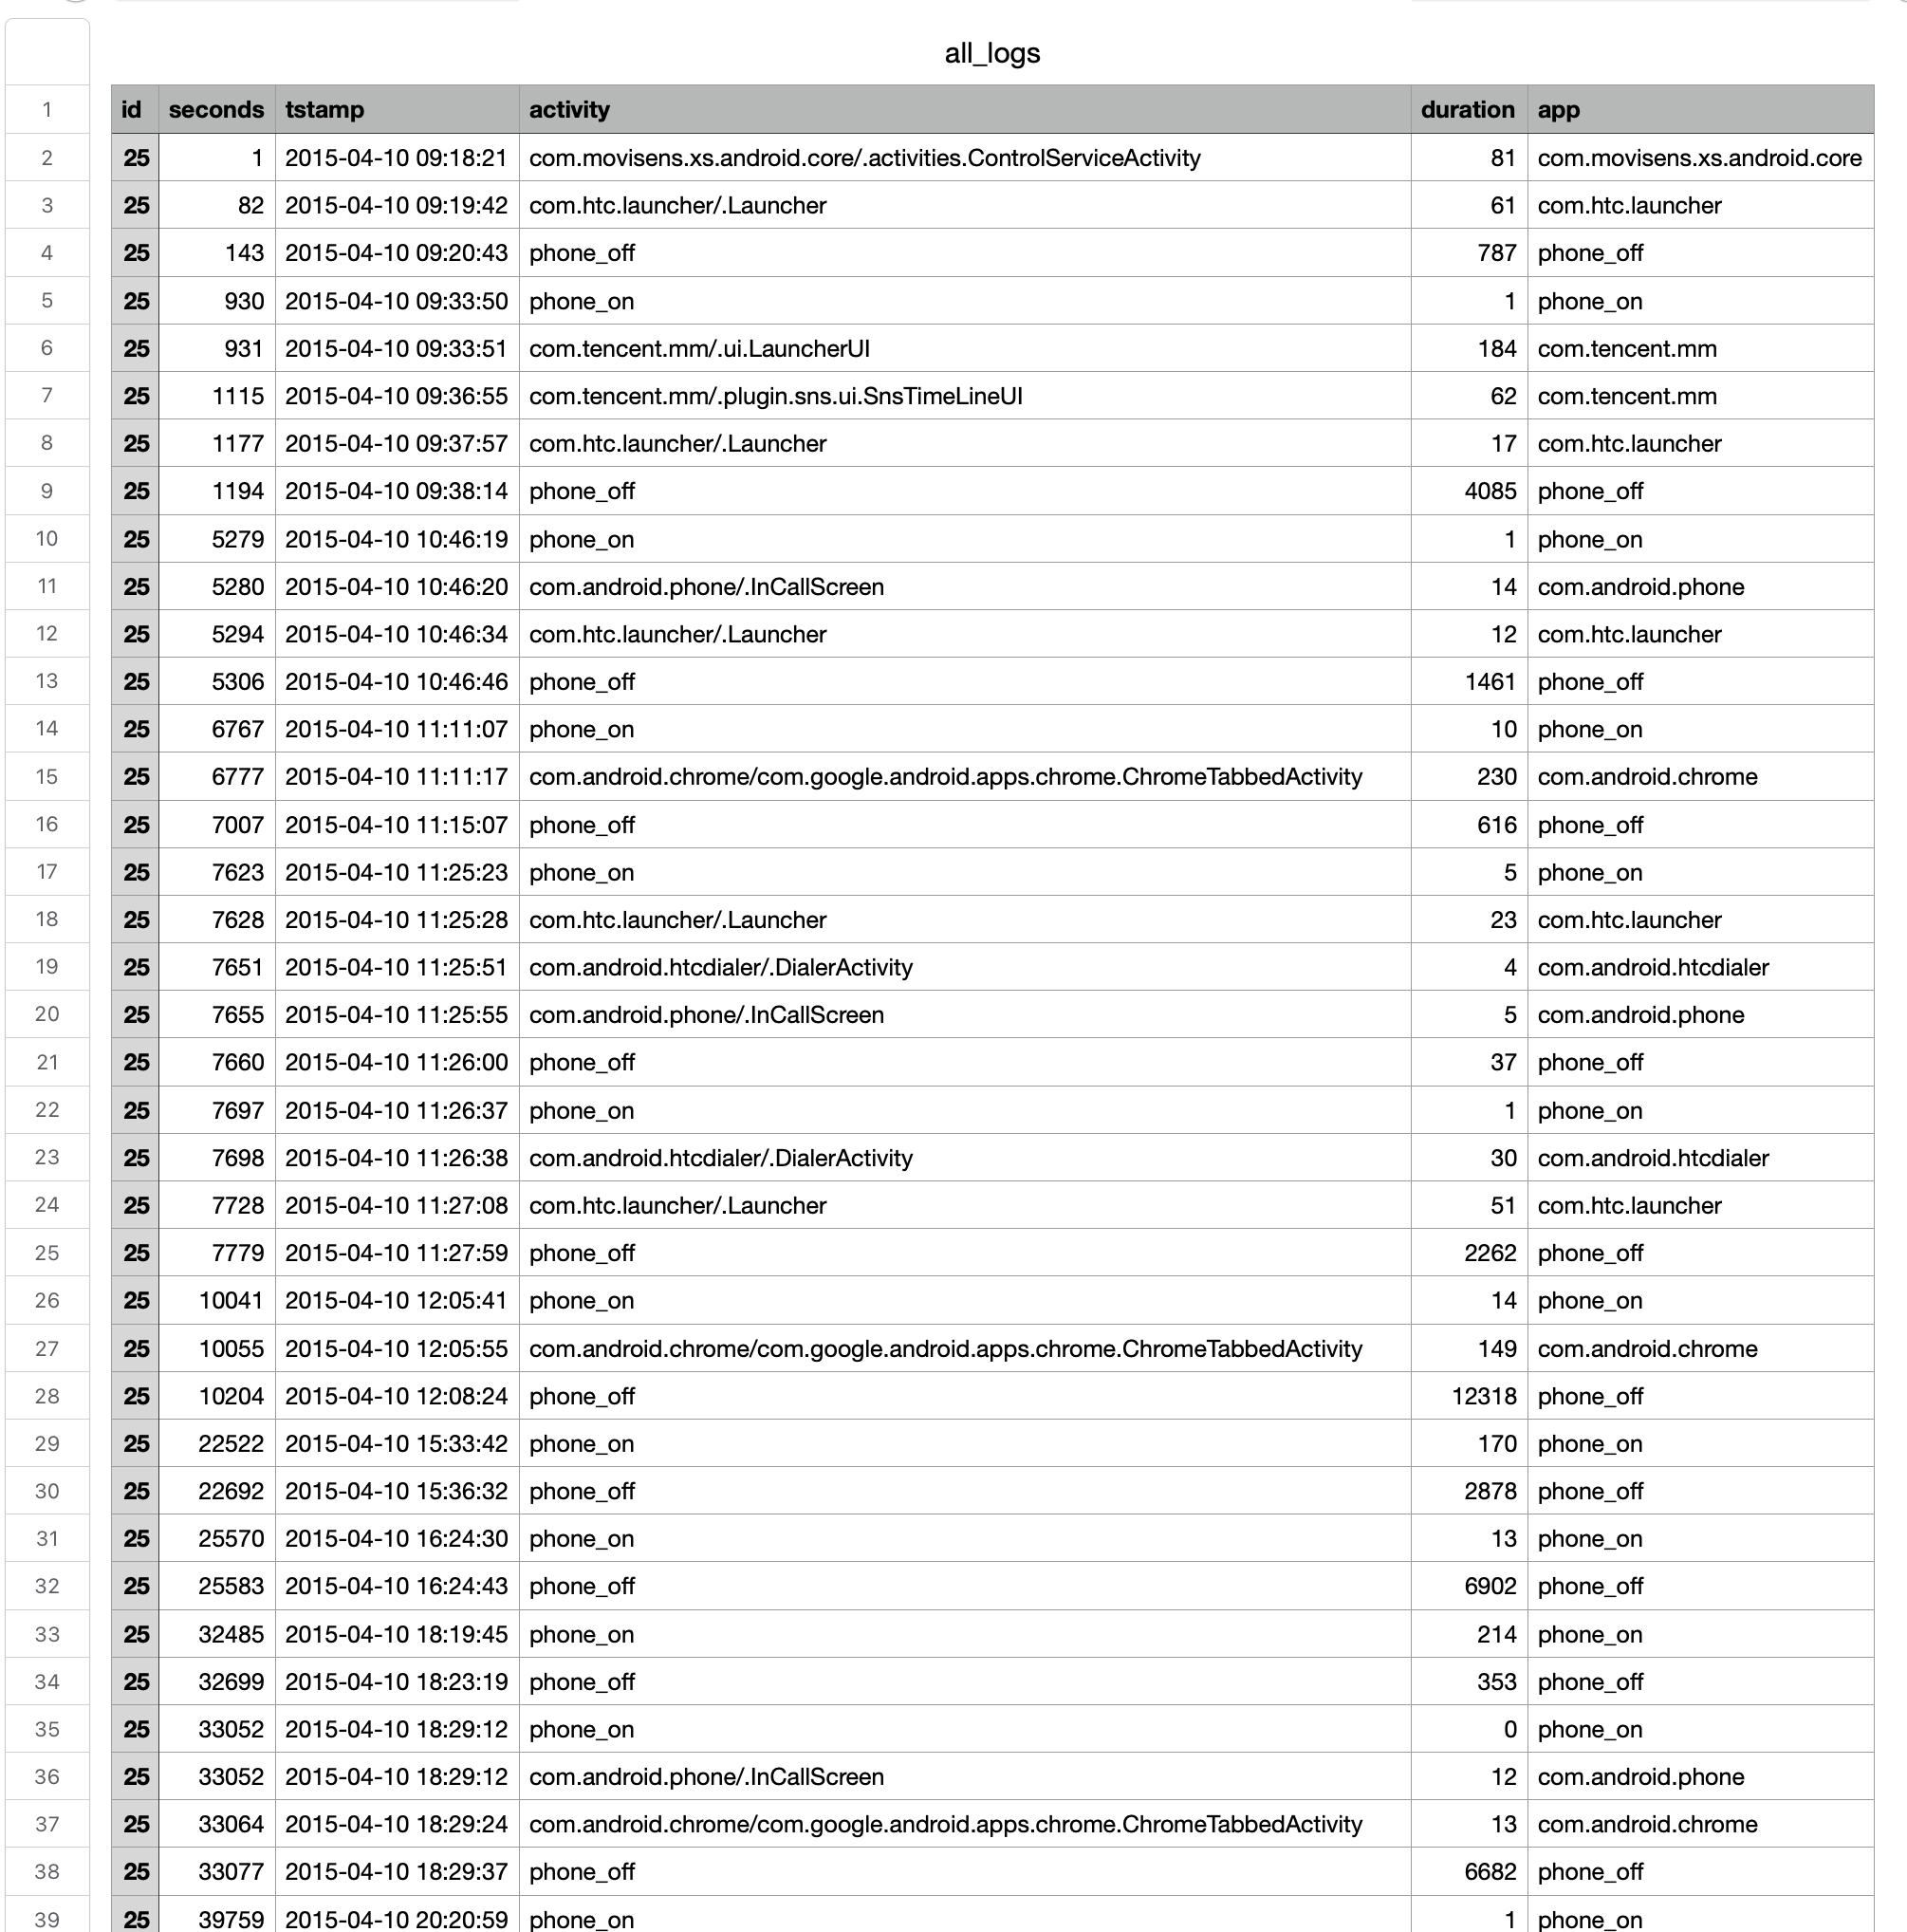
Example data
Smartphone log data (Masur, 2018)
Incredible detailed log of each person’s smartphone use
Big data?
- BIG: Thousands of rows per person, but not many columns
- ALWAYS-ON: Recorded smartphone use at all times
- INCOMPLETE: Did not record app use with higher privacy standards (e.g., signal)
- DIRTY: Depending on what you want to study, lots of noise (e.g., phone on/off)
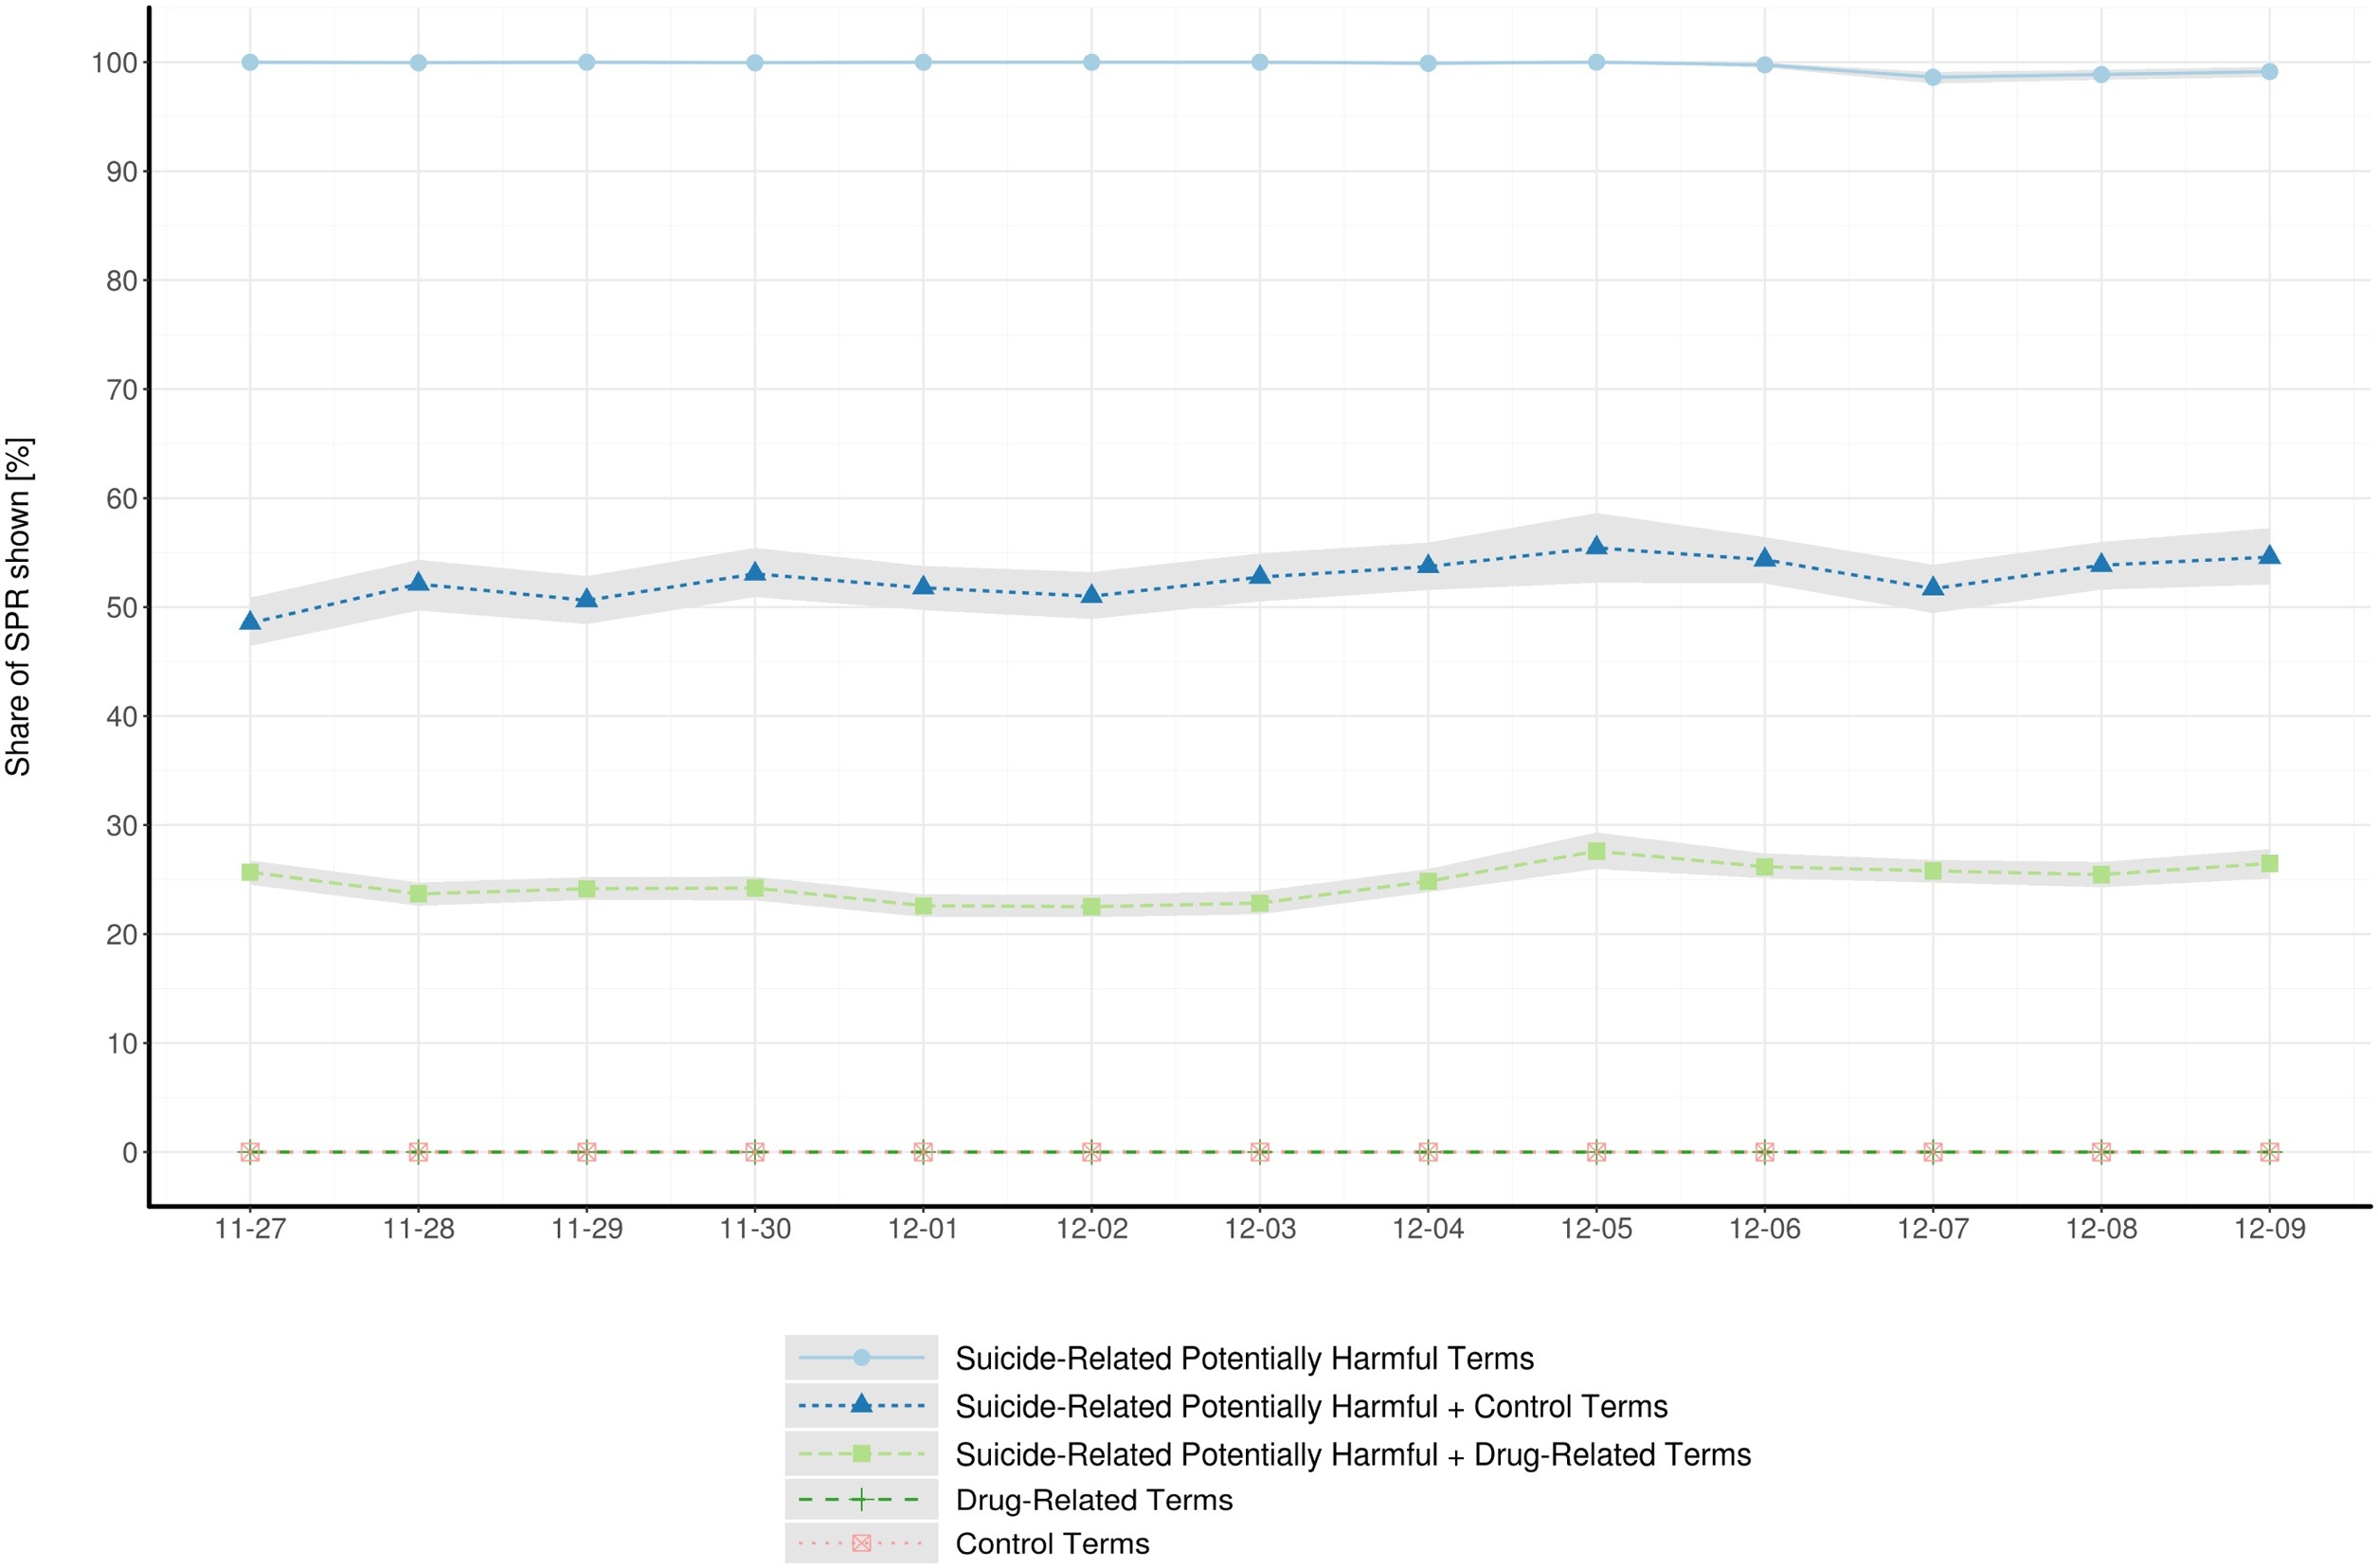
Example 1: Simulating search queries
They conducted 215,999 search requests with varying combinations of search terms
Counseling services were displayed at high rates after suicide-related potentially harmful search queries (e.g., “how to commit suicide”)
Display rates were substantially lower when drug-related terms, indicative of users’ suicidal overdosing tendencies, were added (e.g., “how to commit suicide fentanyl”)
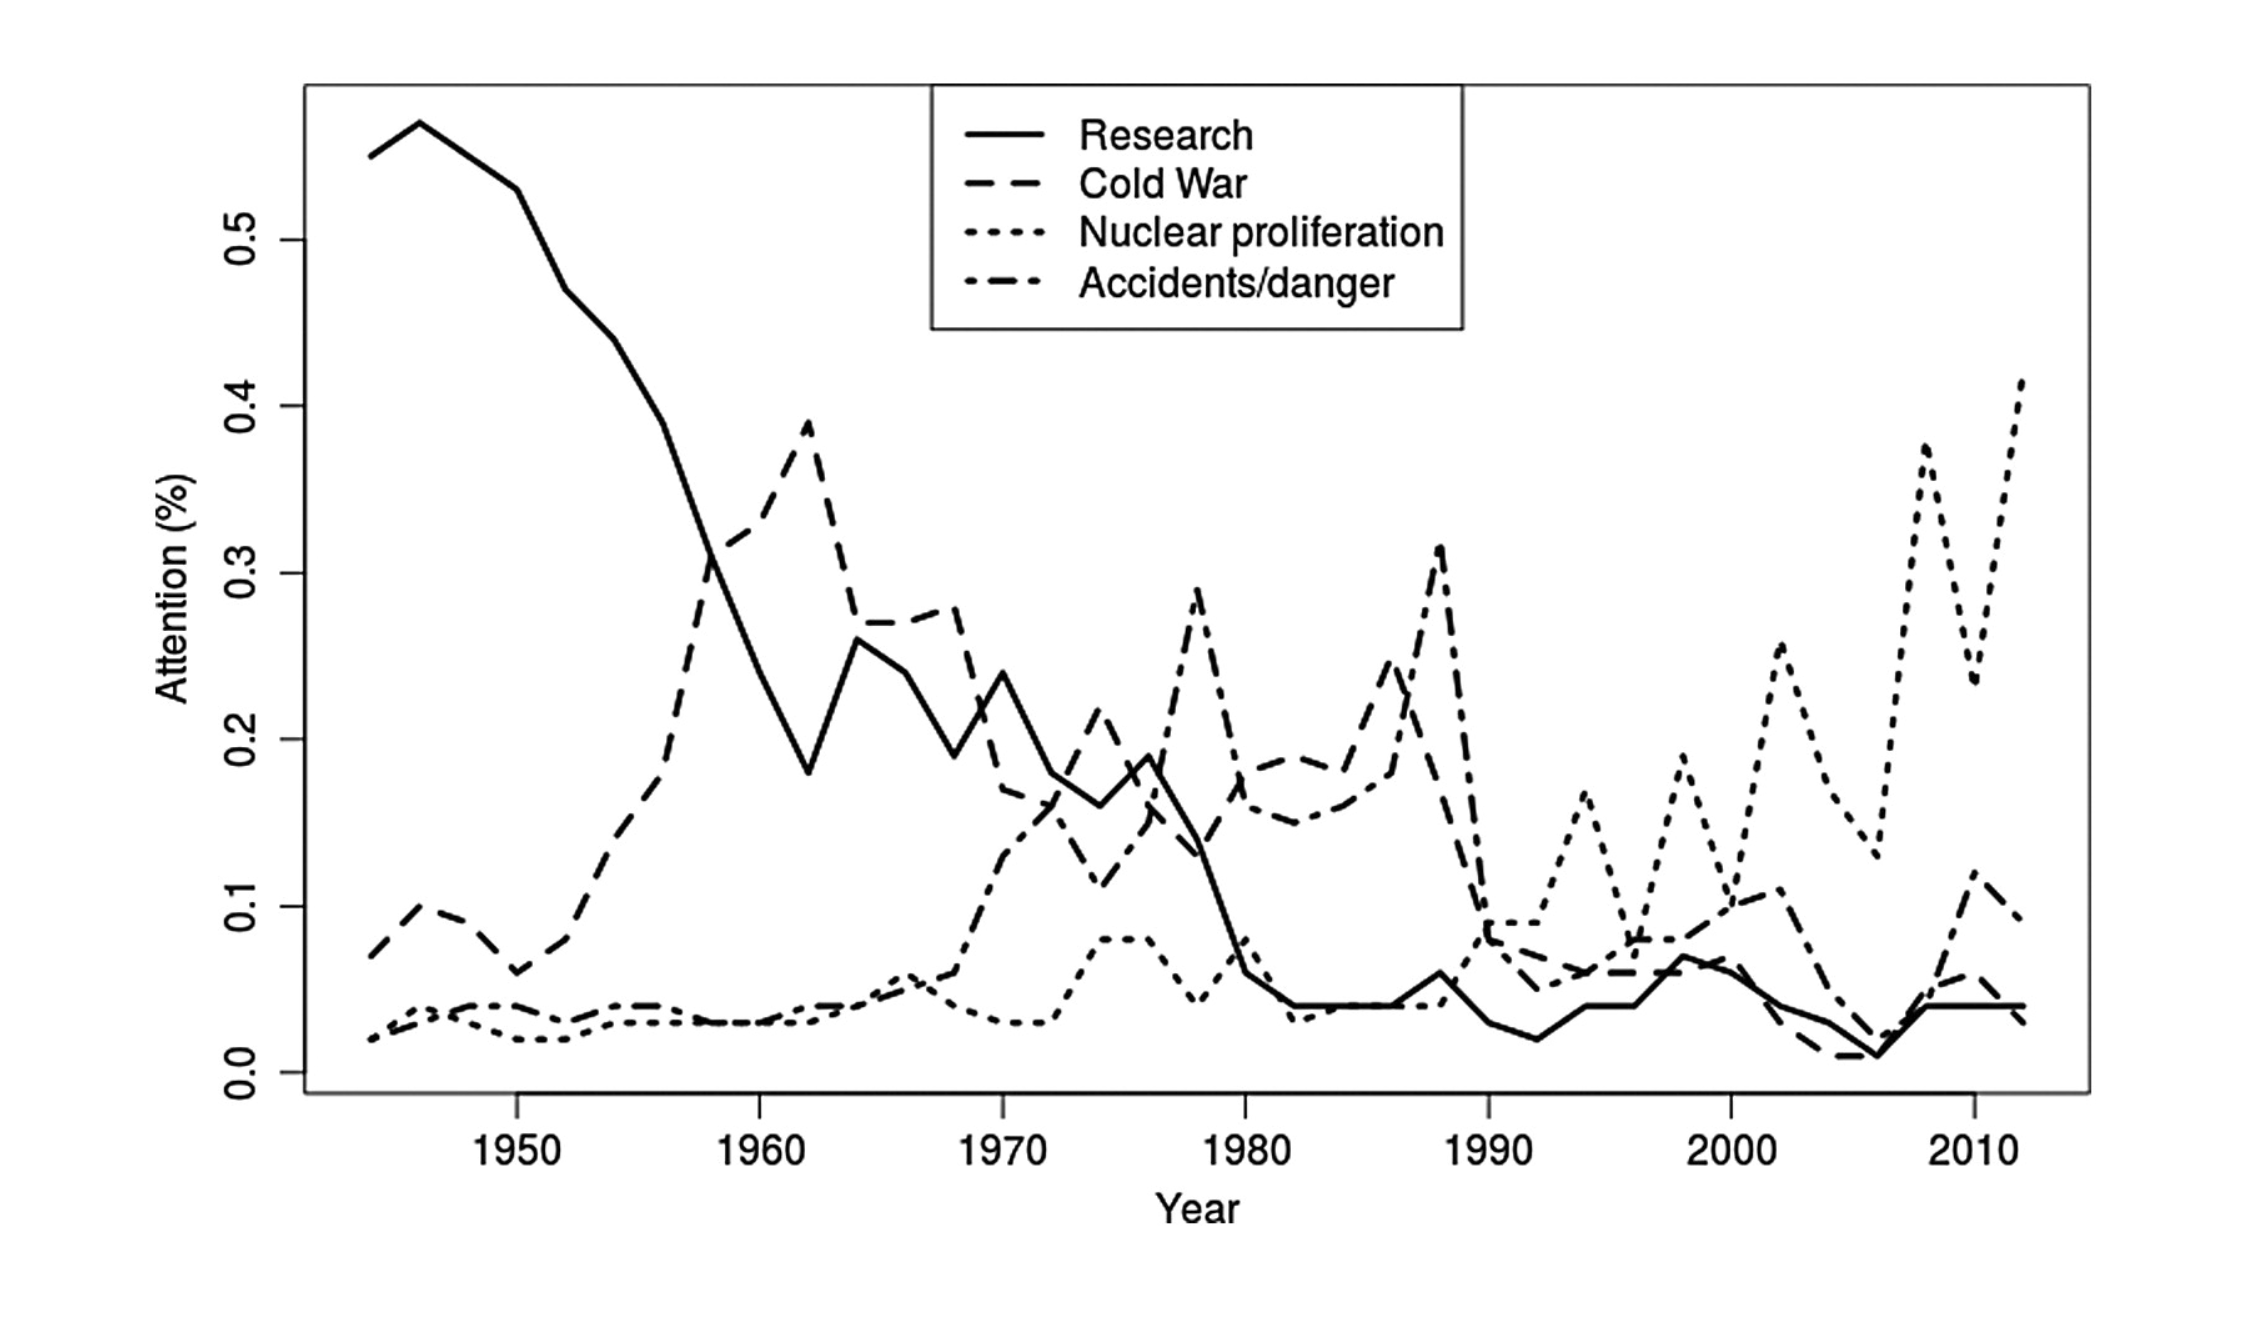
Example 2: Analyzing news coverage
Jacobi and colleagues (2016) analyzed the coverage of nuclear technology from 1945 to the present in the New York Times
Analysis of 51,528 news stories (headline and lead): Way too much for human coding!
Used “topic modeling” to extract latent topics and analyzed their occurrence over time
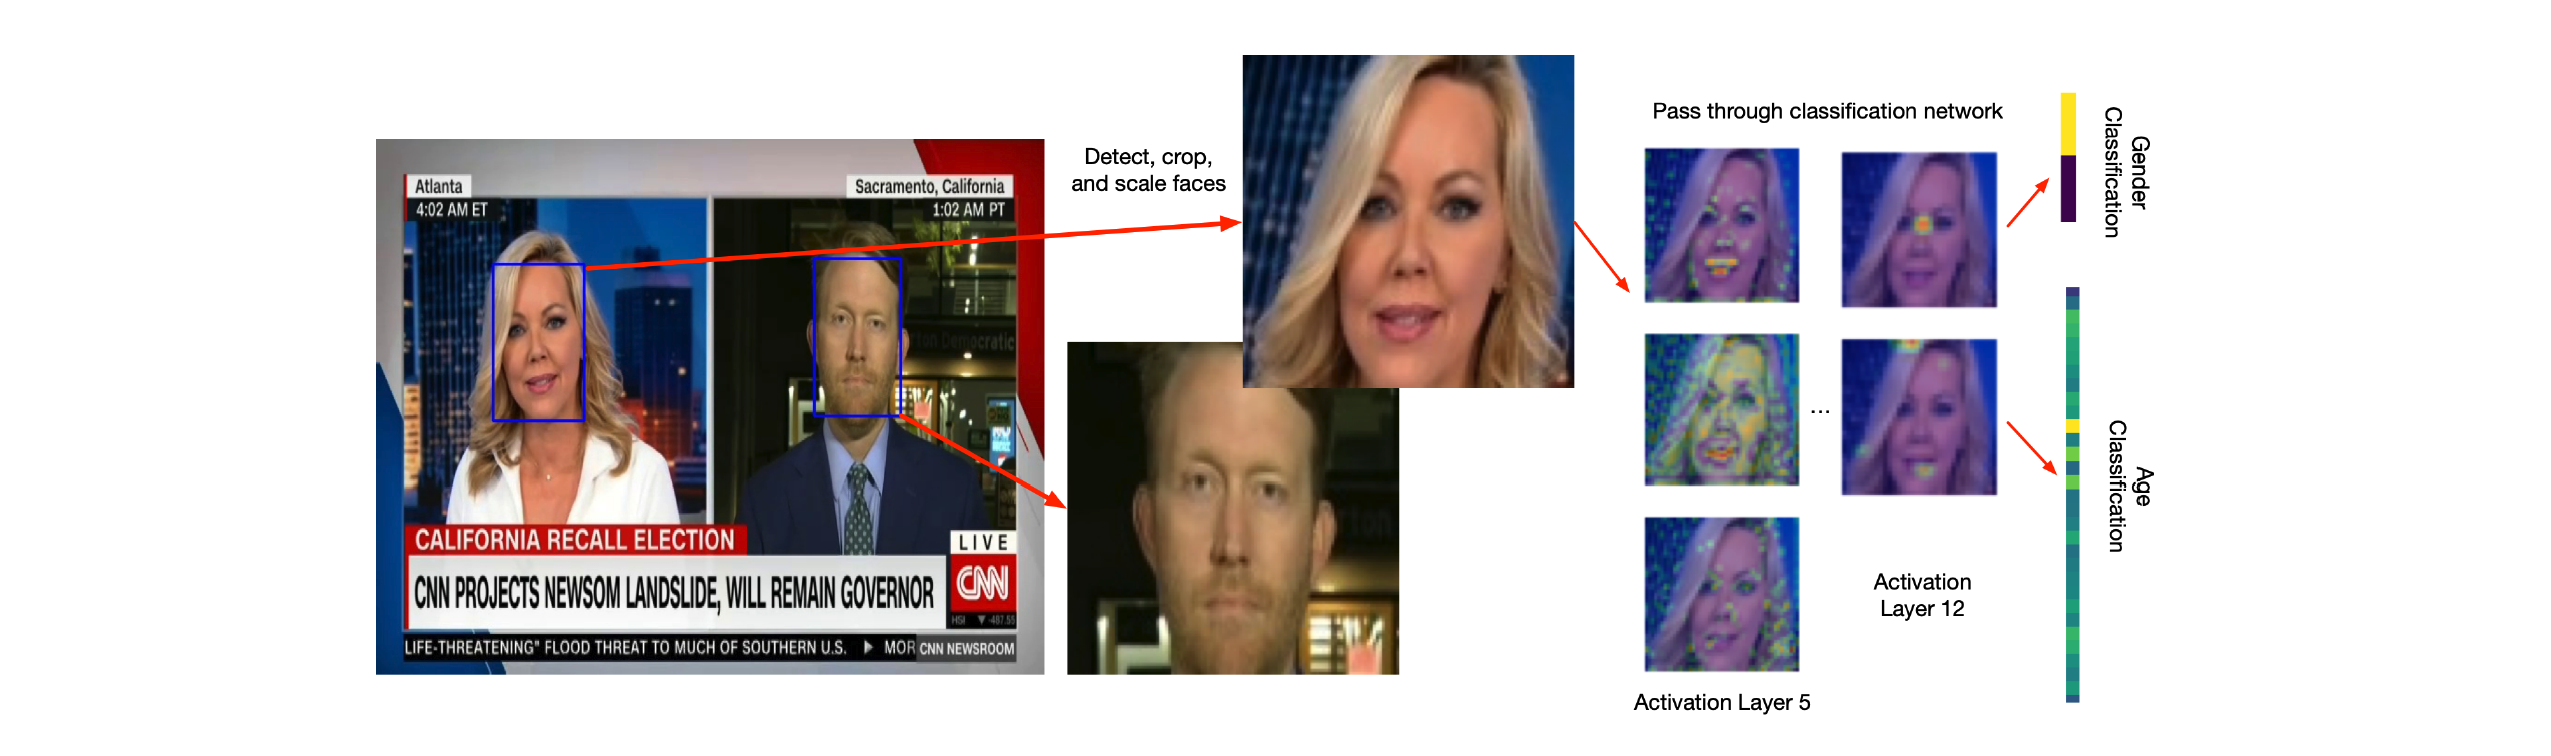
Example 3: Gender representation in TV
Jürgens and colleagues (2021) investigated gender representations in over ten years of daytime TV programming
Usually, this would have required hours and hours (!) of manual coding (i.e., watching a hell lot of TV), but they used neural networks to automatically detect gender in shown faces
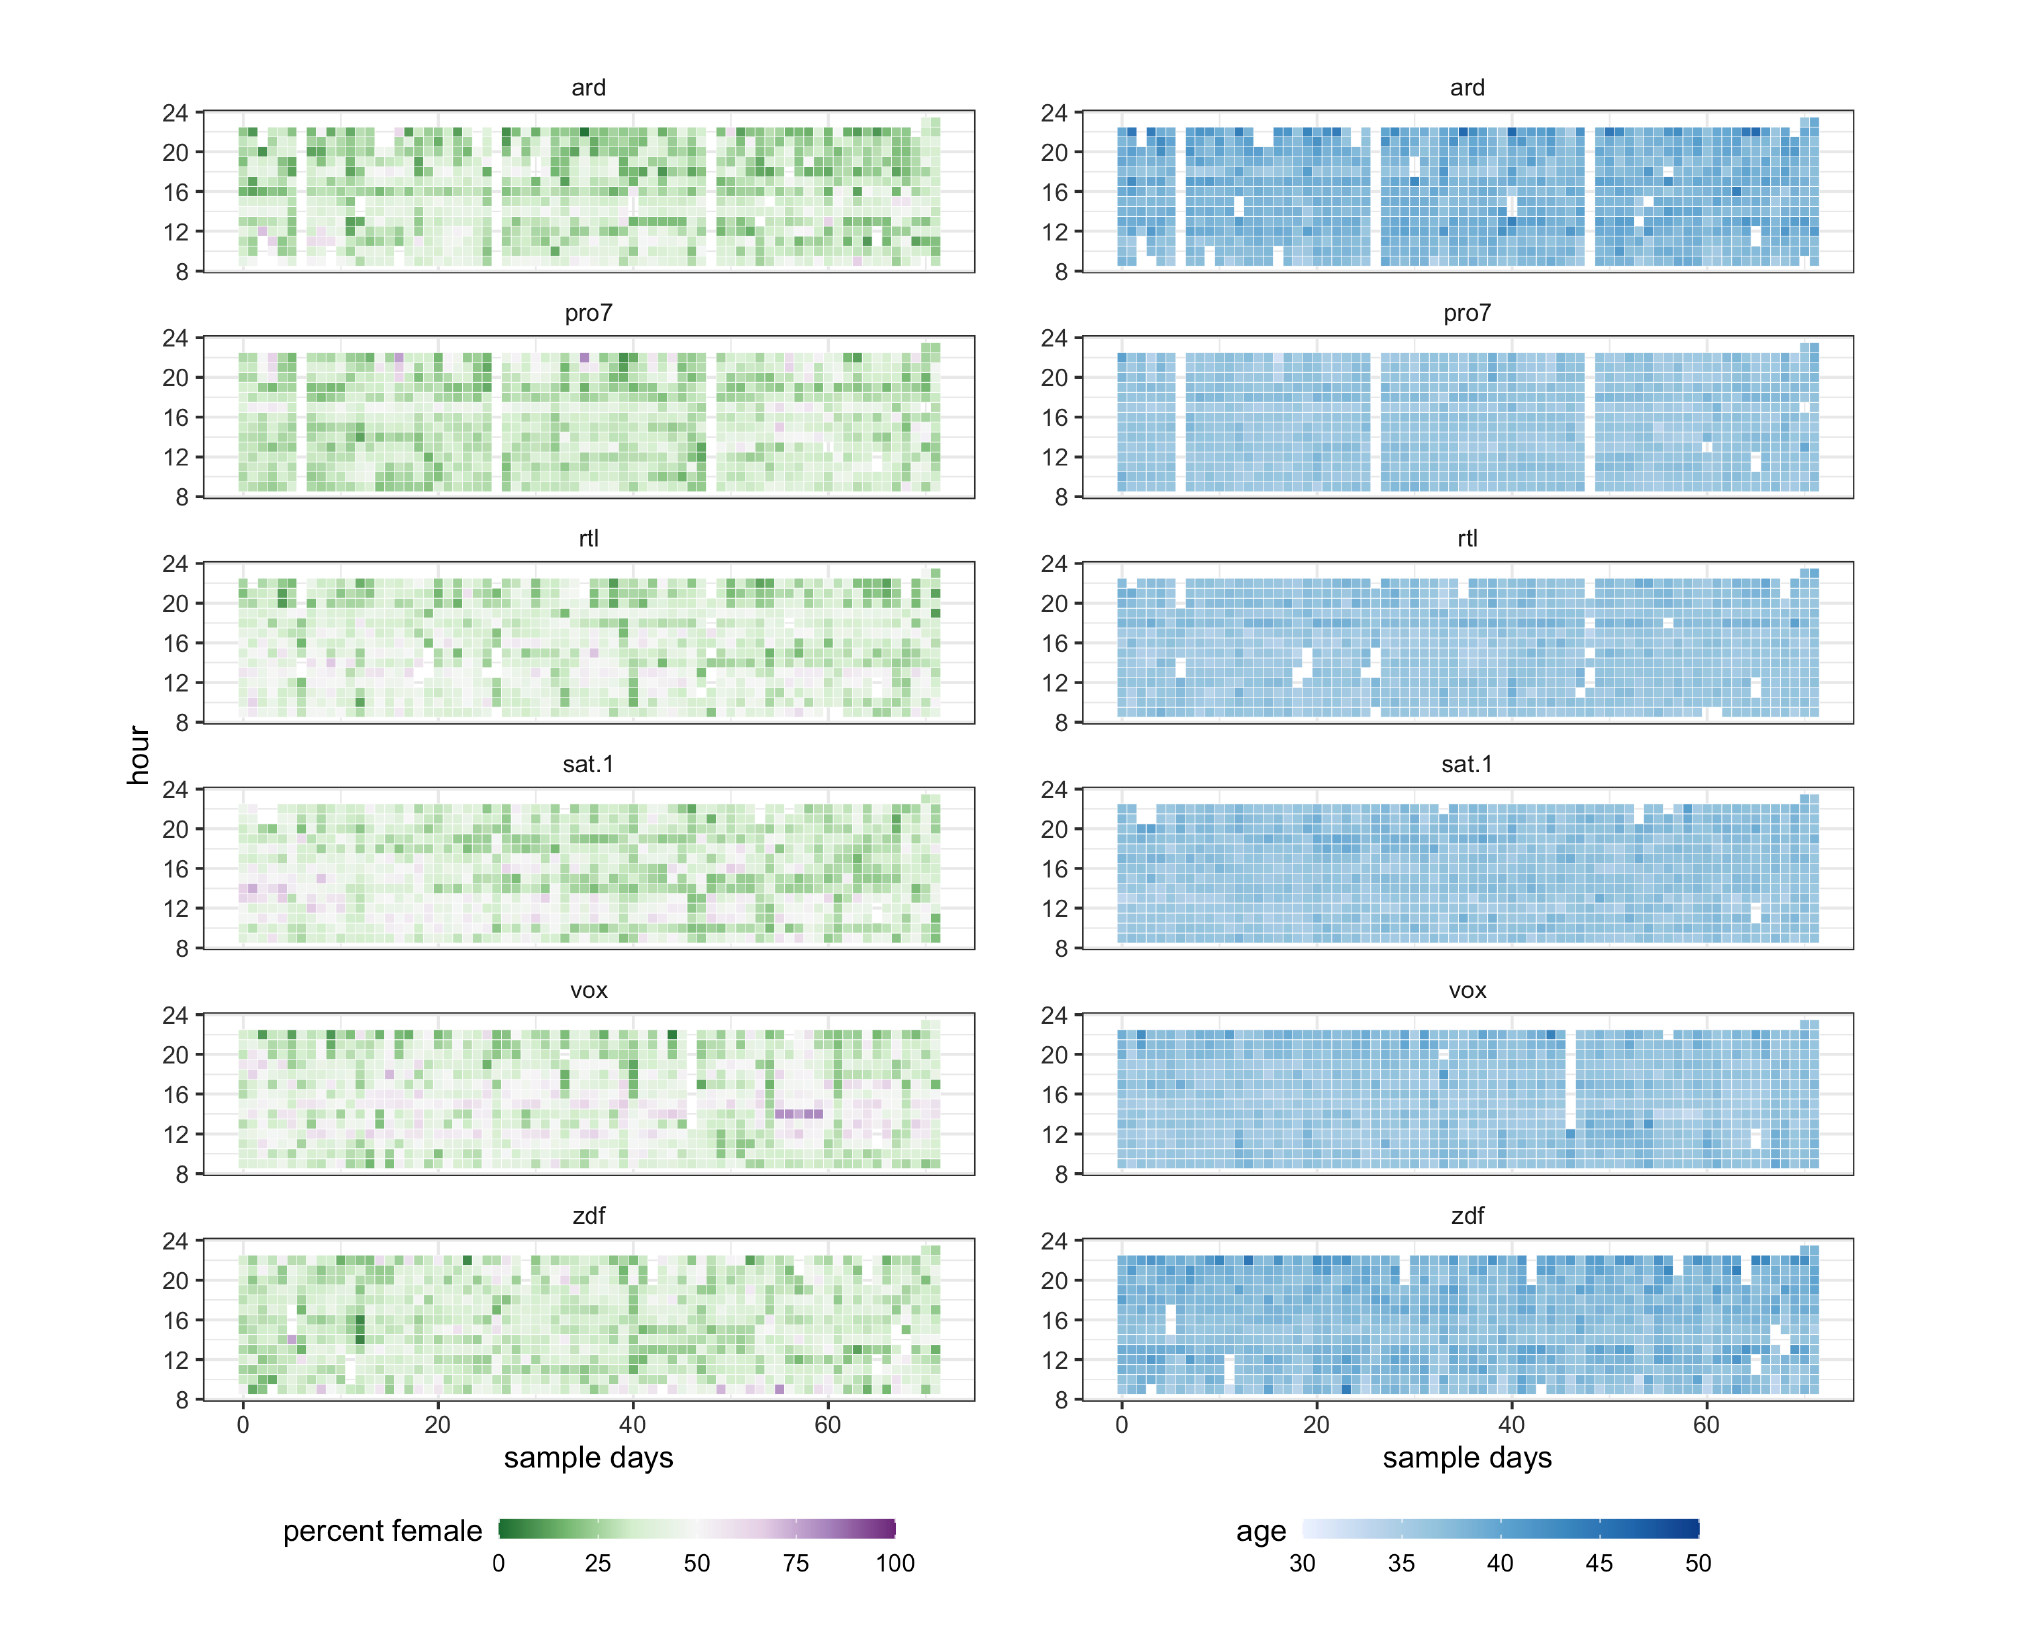
Underrepresentation of women in German TV
Women on average remained underrepresented on TV, with 6.3 million female faces out of 16 million total (estimated proportion .39, 95% CI: .37-.42)
This strong overall bias was mirrored across specific subsamples (news, sports, advertising…)
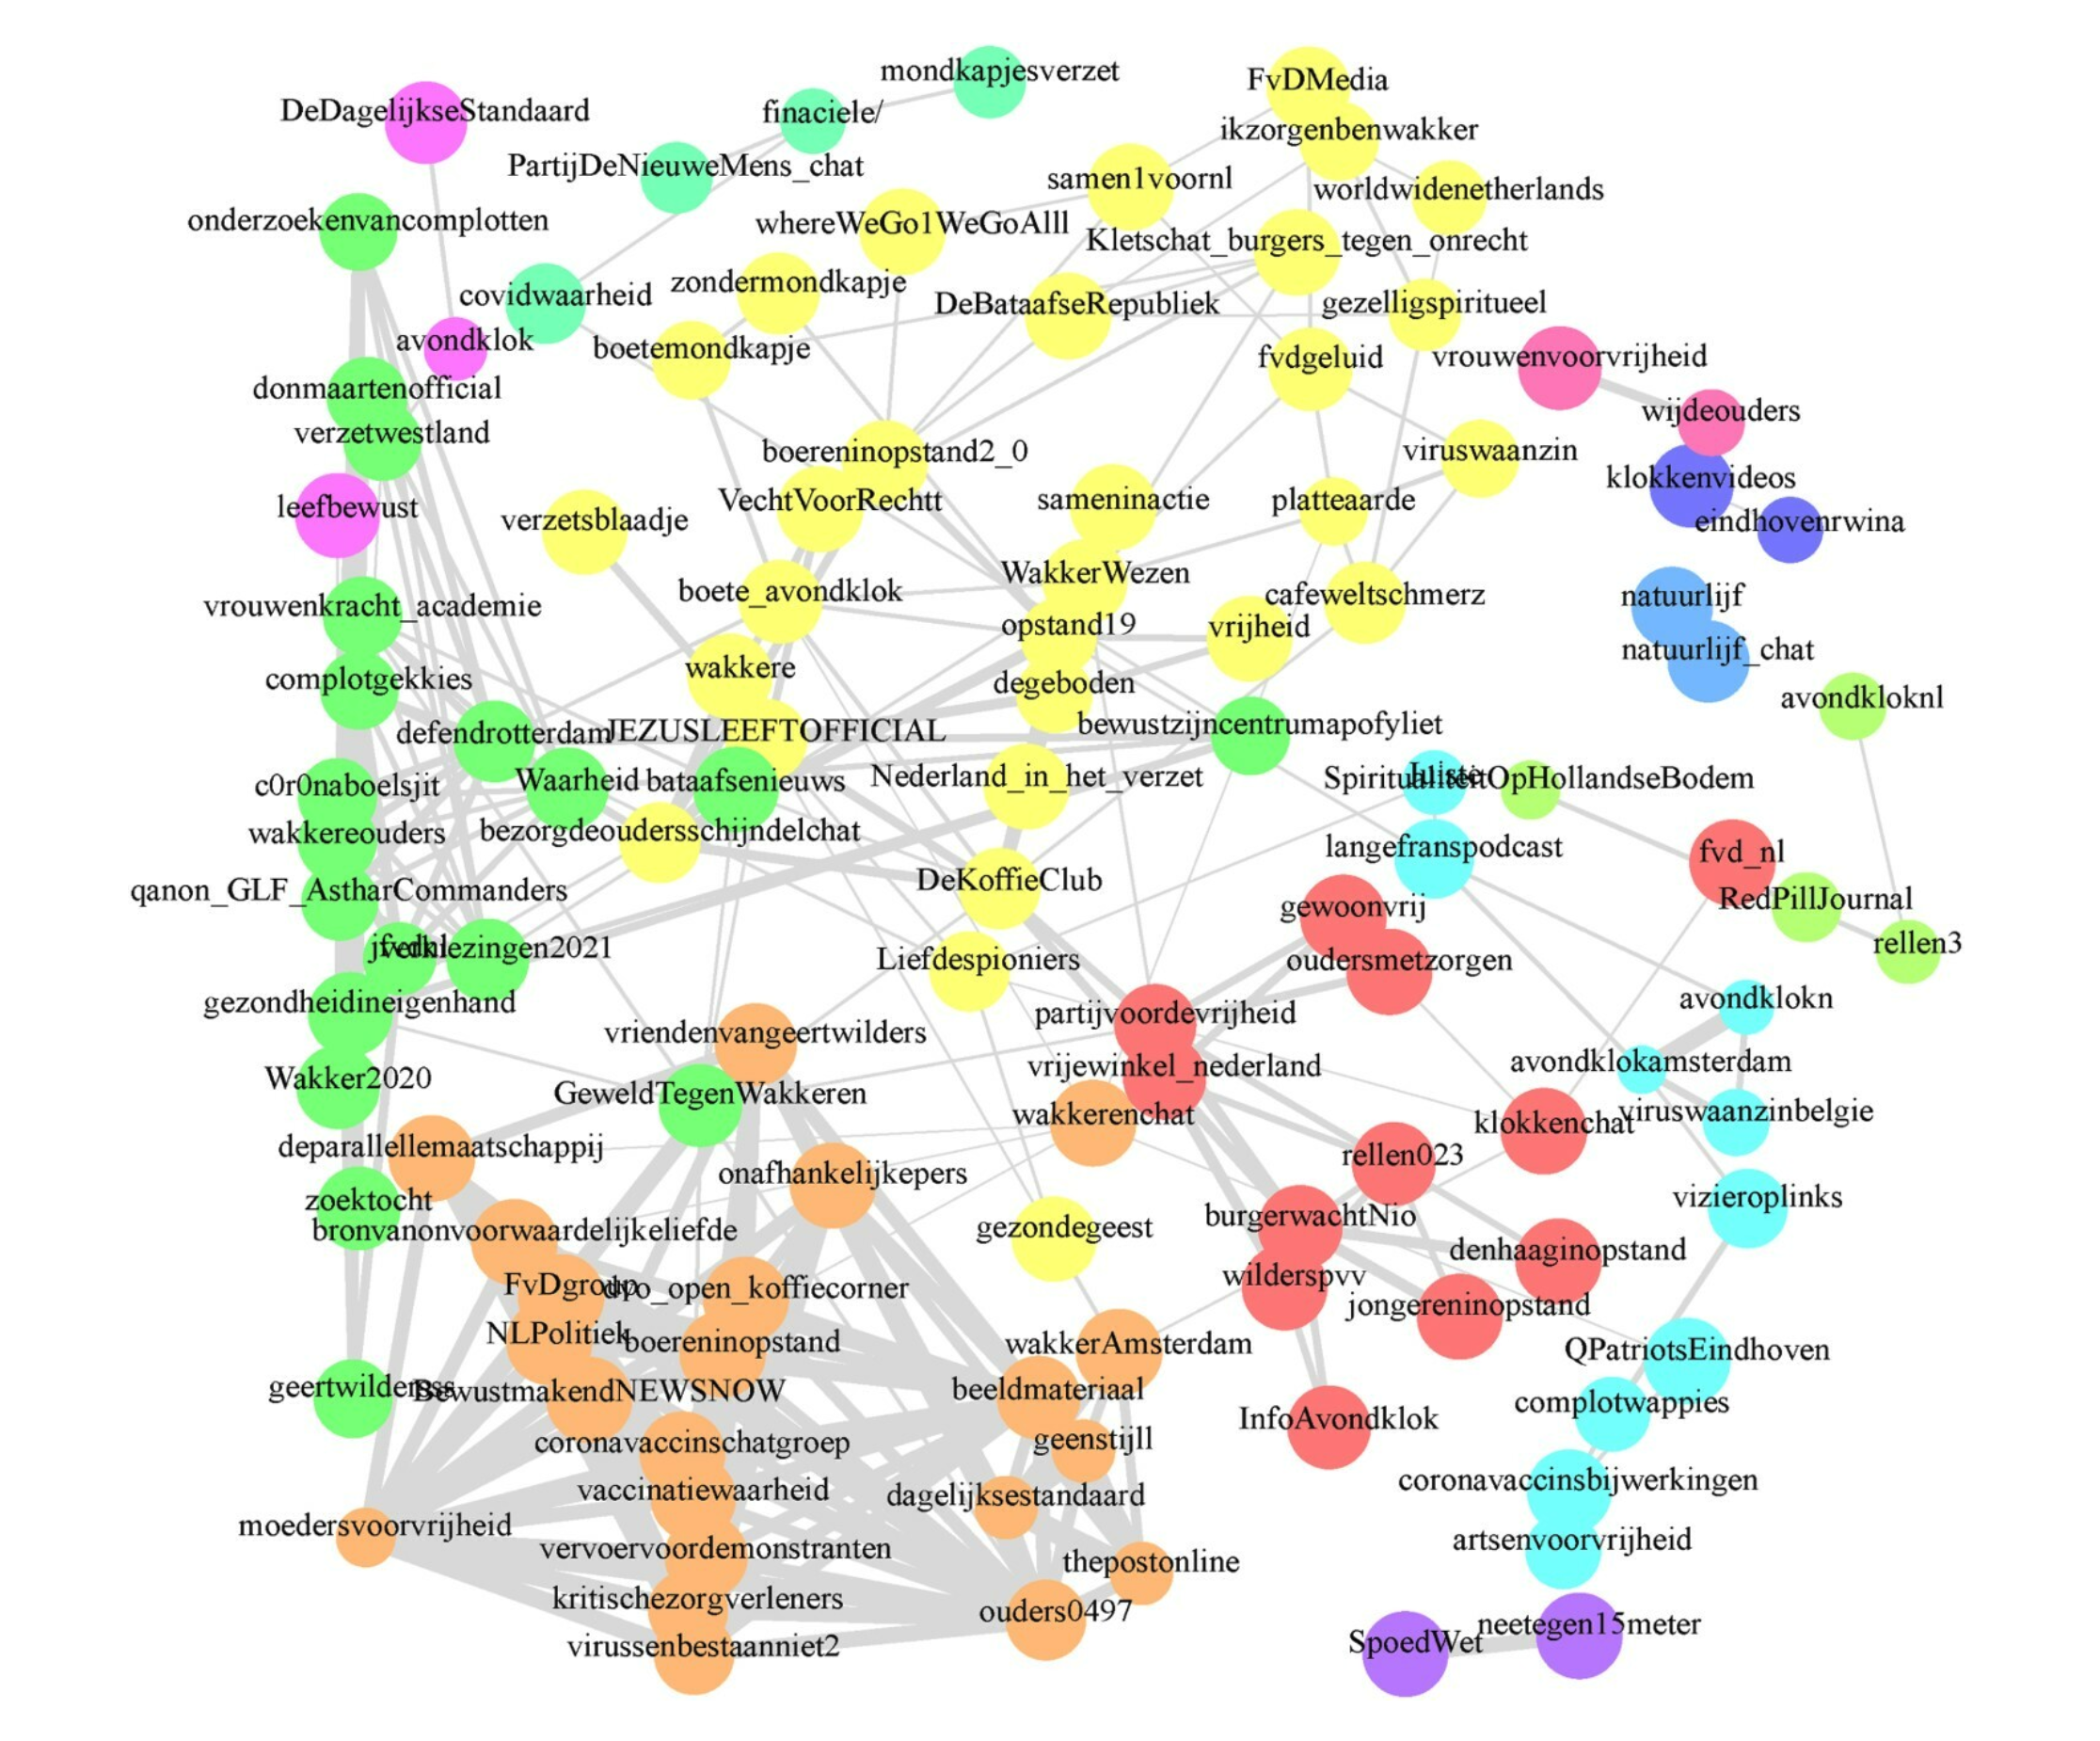
Example 4: Dutch Telegramsphere
Simon et al. (2022) collected the full messaging history (N = 2,033,661) of 174 Dutch-language public Telegram chats/channels
Among other things, used advanced topic modeling and network analyses
Authors found that over time, conspiracy-themed, far-right activist, and COVID-19-sceptical communities dominated
Their findings raise concerns with respect to Telegram’s polarization and radicalization capacity
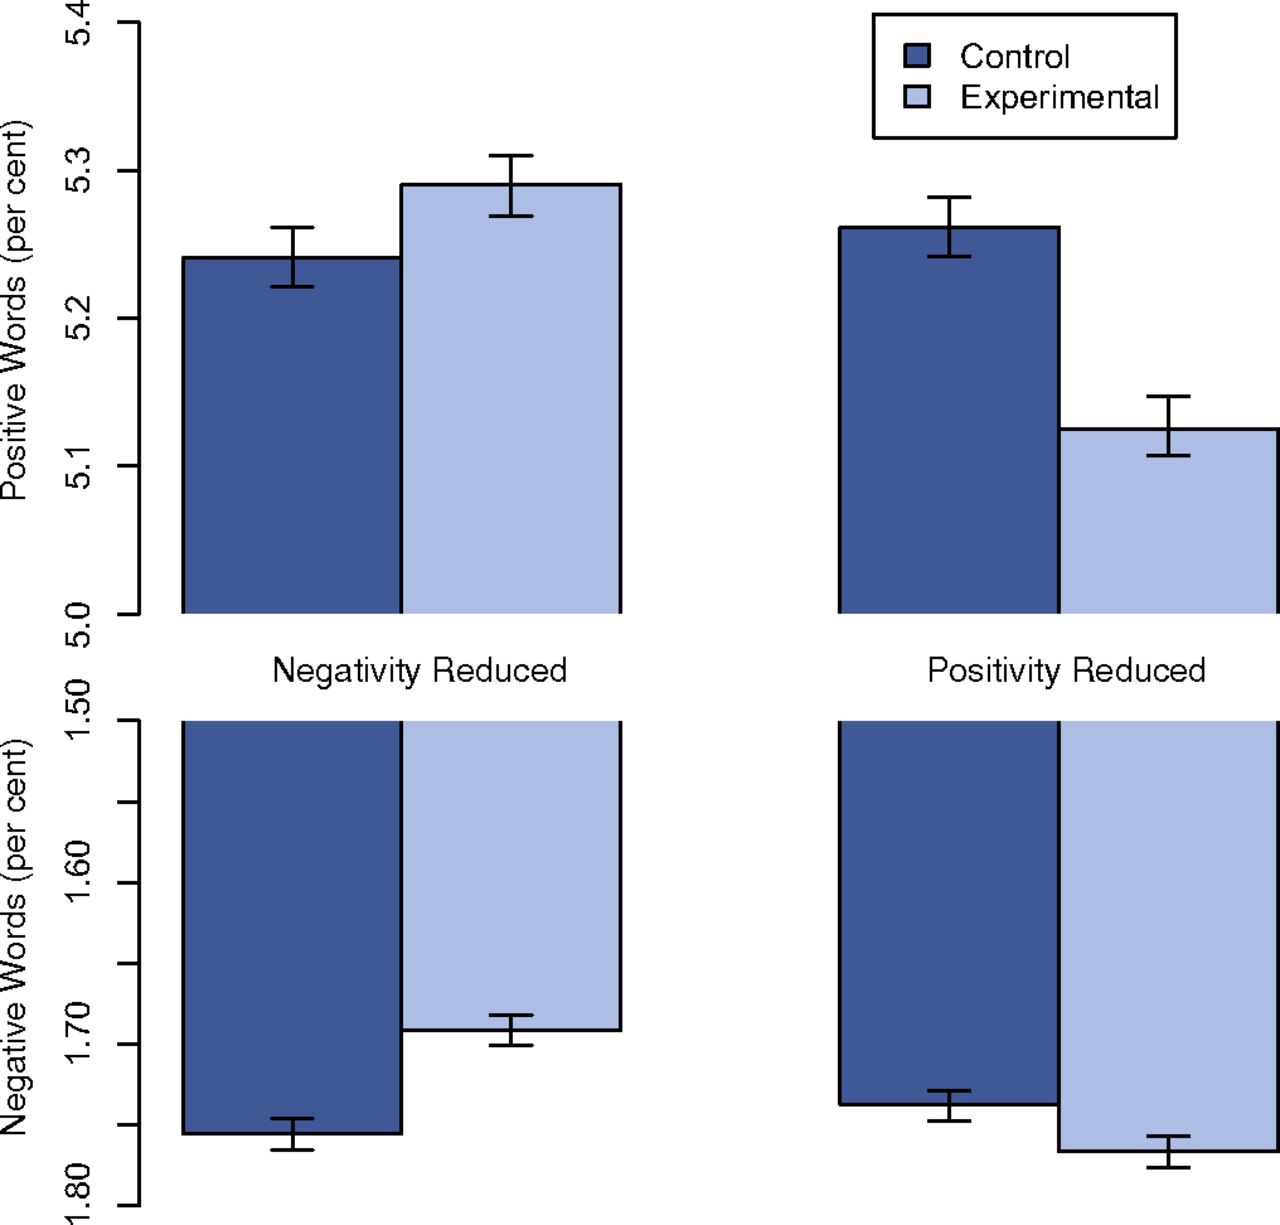
Computational technique: Sentiment Analysis
LIWC word list (Linguistic Inquiry and Word Count; Pennebaker et al)
406 positive words: e.g., love, nice, sweet, etc.
399 negative words (and subcategories): e.g. hurt, ugly, nasty
Count occurrences of words in both categories, subtract negative from positive
Preliminary summary
![]() Computational communication research holds manifold promises
Computational communication research holds manifold promisesWe can harness unusual sources of information and large amounts of data, particularly because people constantly leave digital traces
New methods allow to structure, aggregate and make sense of these data and extract meaningful information to study communication behavior and phenomena
However, computational communication research comes with ethical challenges related to consent, privacy, and autonomy of the participants
 Computational communication research holds manifold promises
Teachers
| Dr. Philipp K. Masur | Dr. Kaspar Welbers | Dr. Alberto López Ortega | Santiago Gómez-Echeverry | Emma Diel | ||||
|---|---|---|---|---|---|---|---|---|
 |
 |
 |
 |
 |
||||
| Lecturer & Course Coordinator | Teacher | Teacher | Teacher | Teacher |
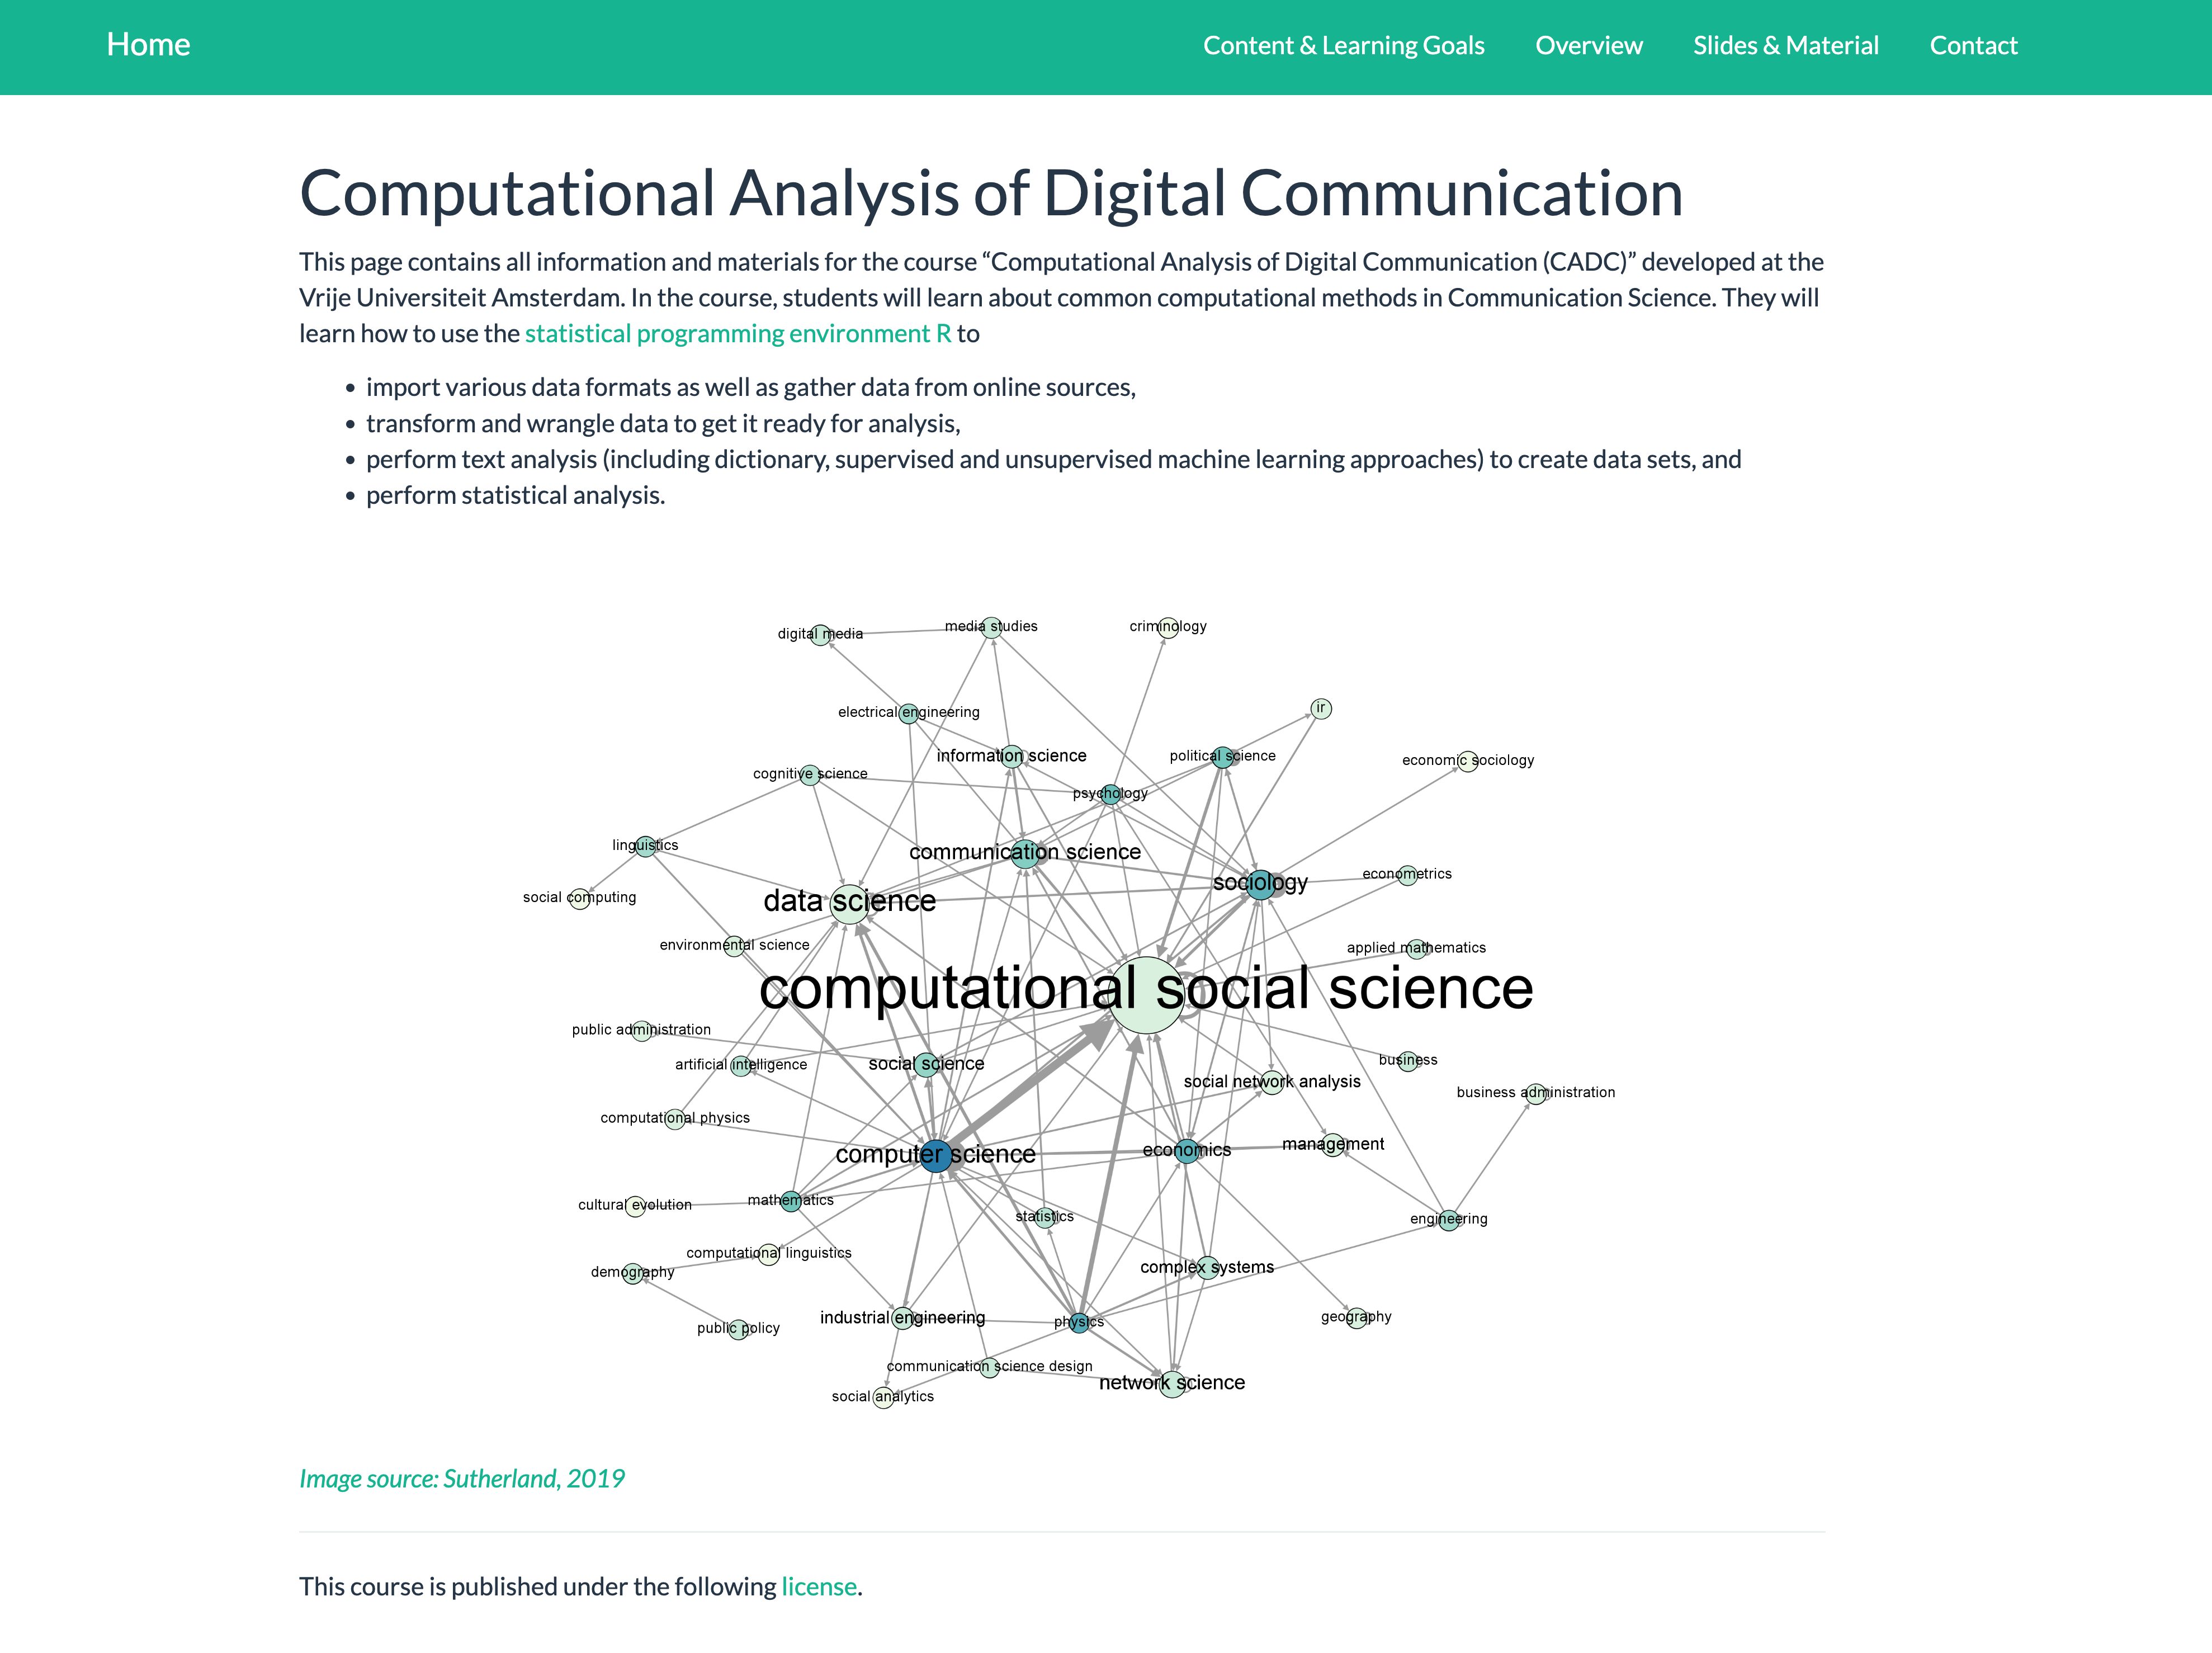
Information and Materials
The major hub for this course is the following website:
Communication and assignment submission via Canvas
- S_CADC: Computationele analyse van digitale communicatie
What is ‘R’?
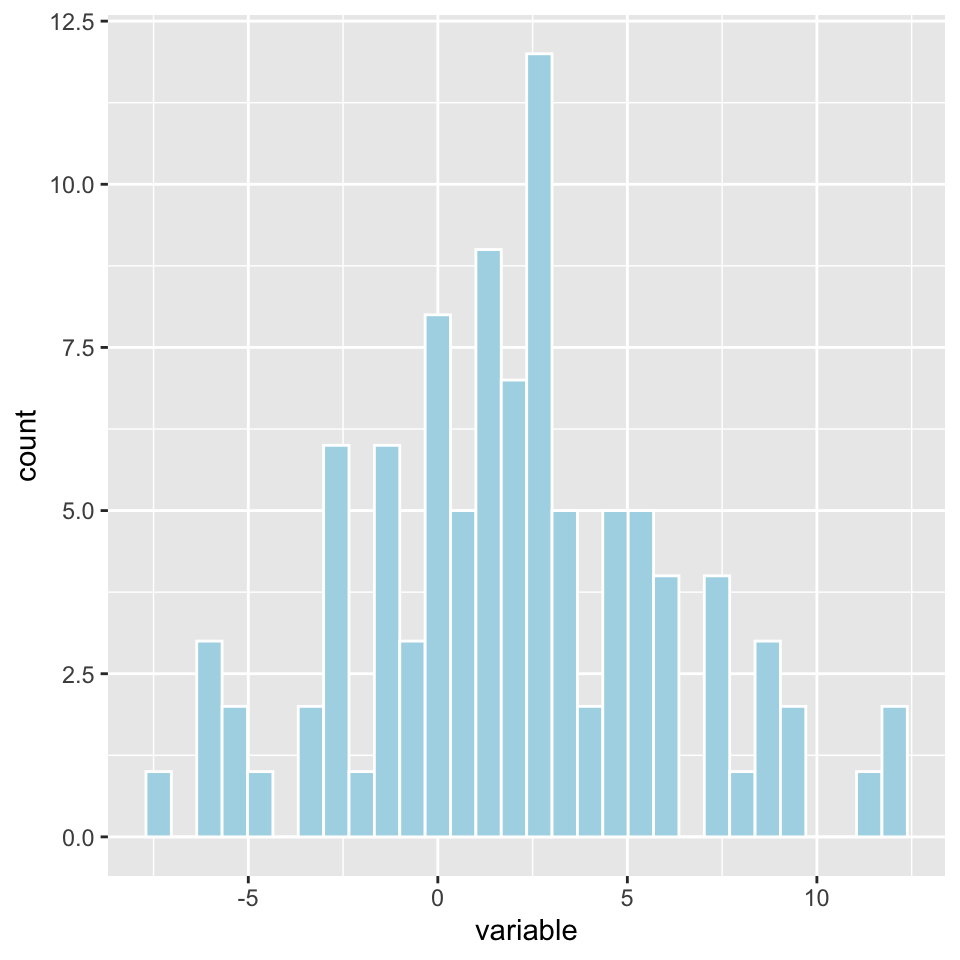
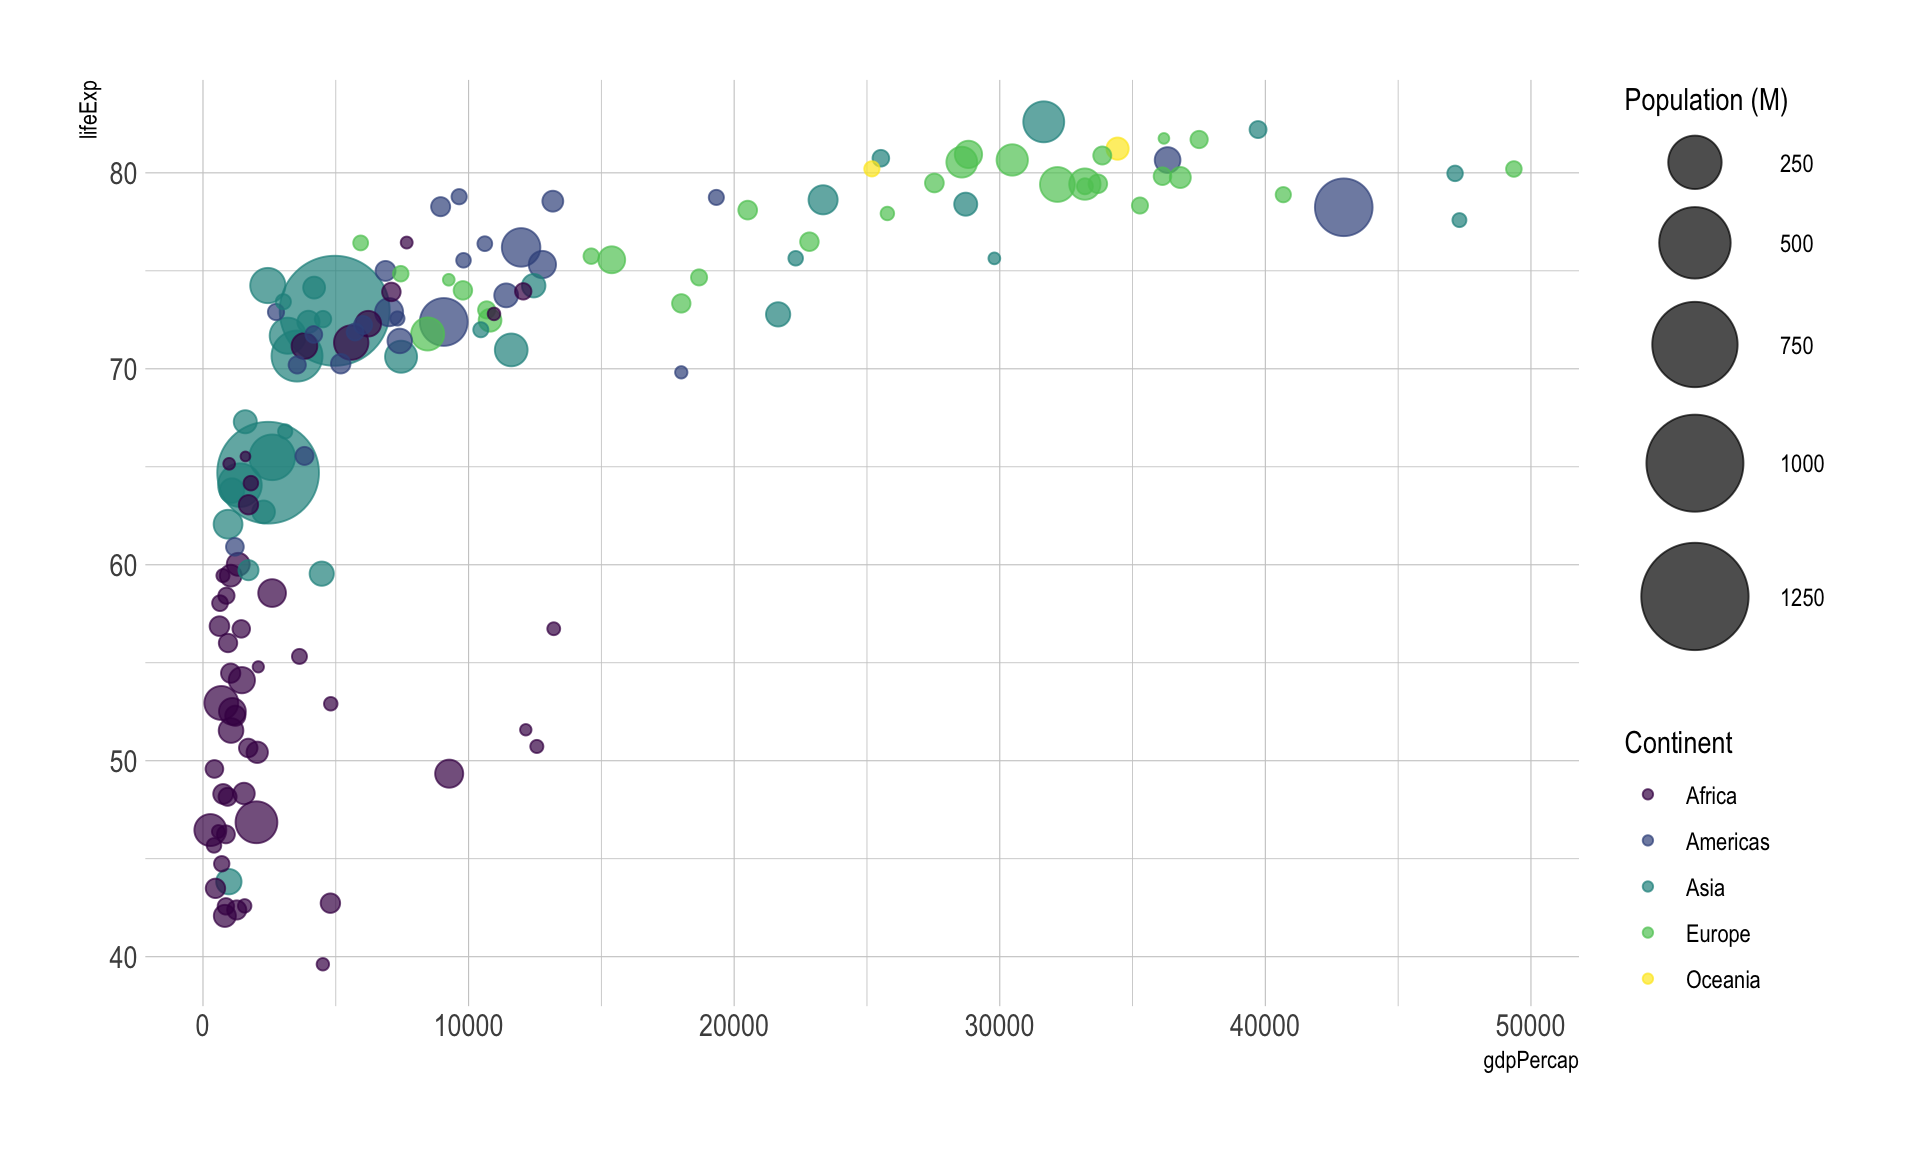
Advantages of R: Visualization
- Allows to produce publication-ready figures and visualizations
- Allows to combine analyses and writing to produces diverse output formats (e.g., these slides)
Example Exam Question (Open Format)
Name and explain two characteristics of big data.
(4 points, 2 points for correctly naming them and 2 points for correctly explaining them)
Big data are often “incomplete”: This means they do not have the information that you will want for your research. This is a common feature of data that were created for purposes other than research. For example, log data (e.g., browser history) includes all links a person has visited over time, but does not provide any additional information. More over, it may contain gaps where the software failed or the person purposefully hid his surfing behavior.
Big data are often “algorithmically confounded”: Behavior in big data systems is not natural; it is driven by the engineering goals of the systems. For example, what you see on a facebook news feed depends on algorithm that Facebook has built into their platform. Behavior of individuals is thus also driven by these system-immanent features.
![]()