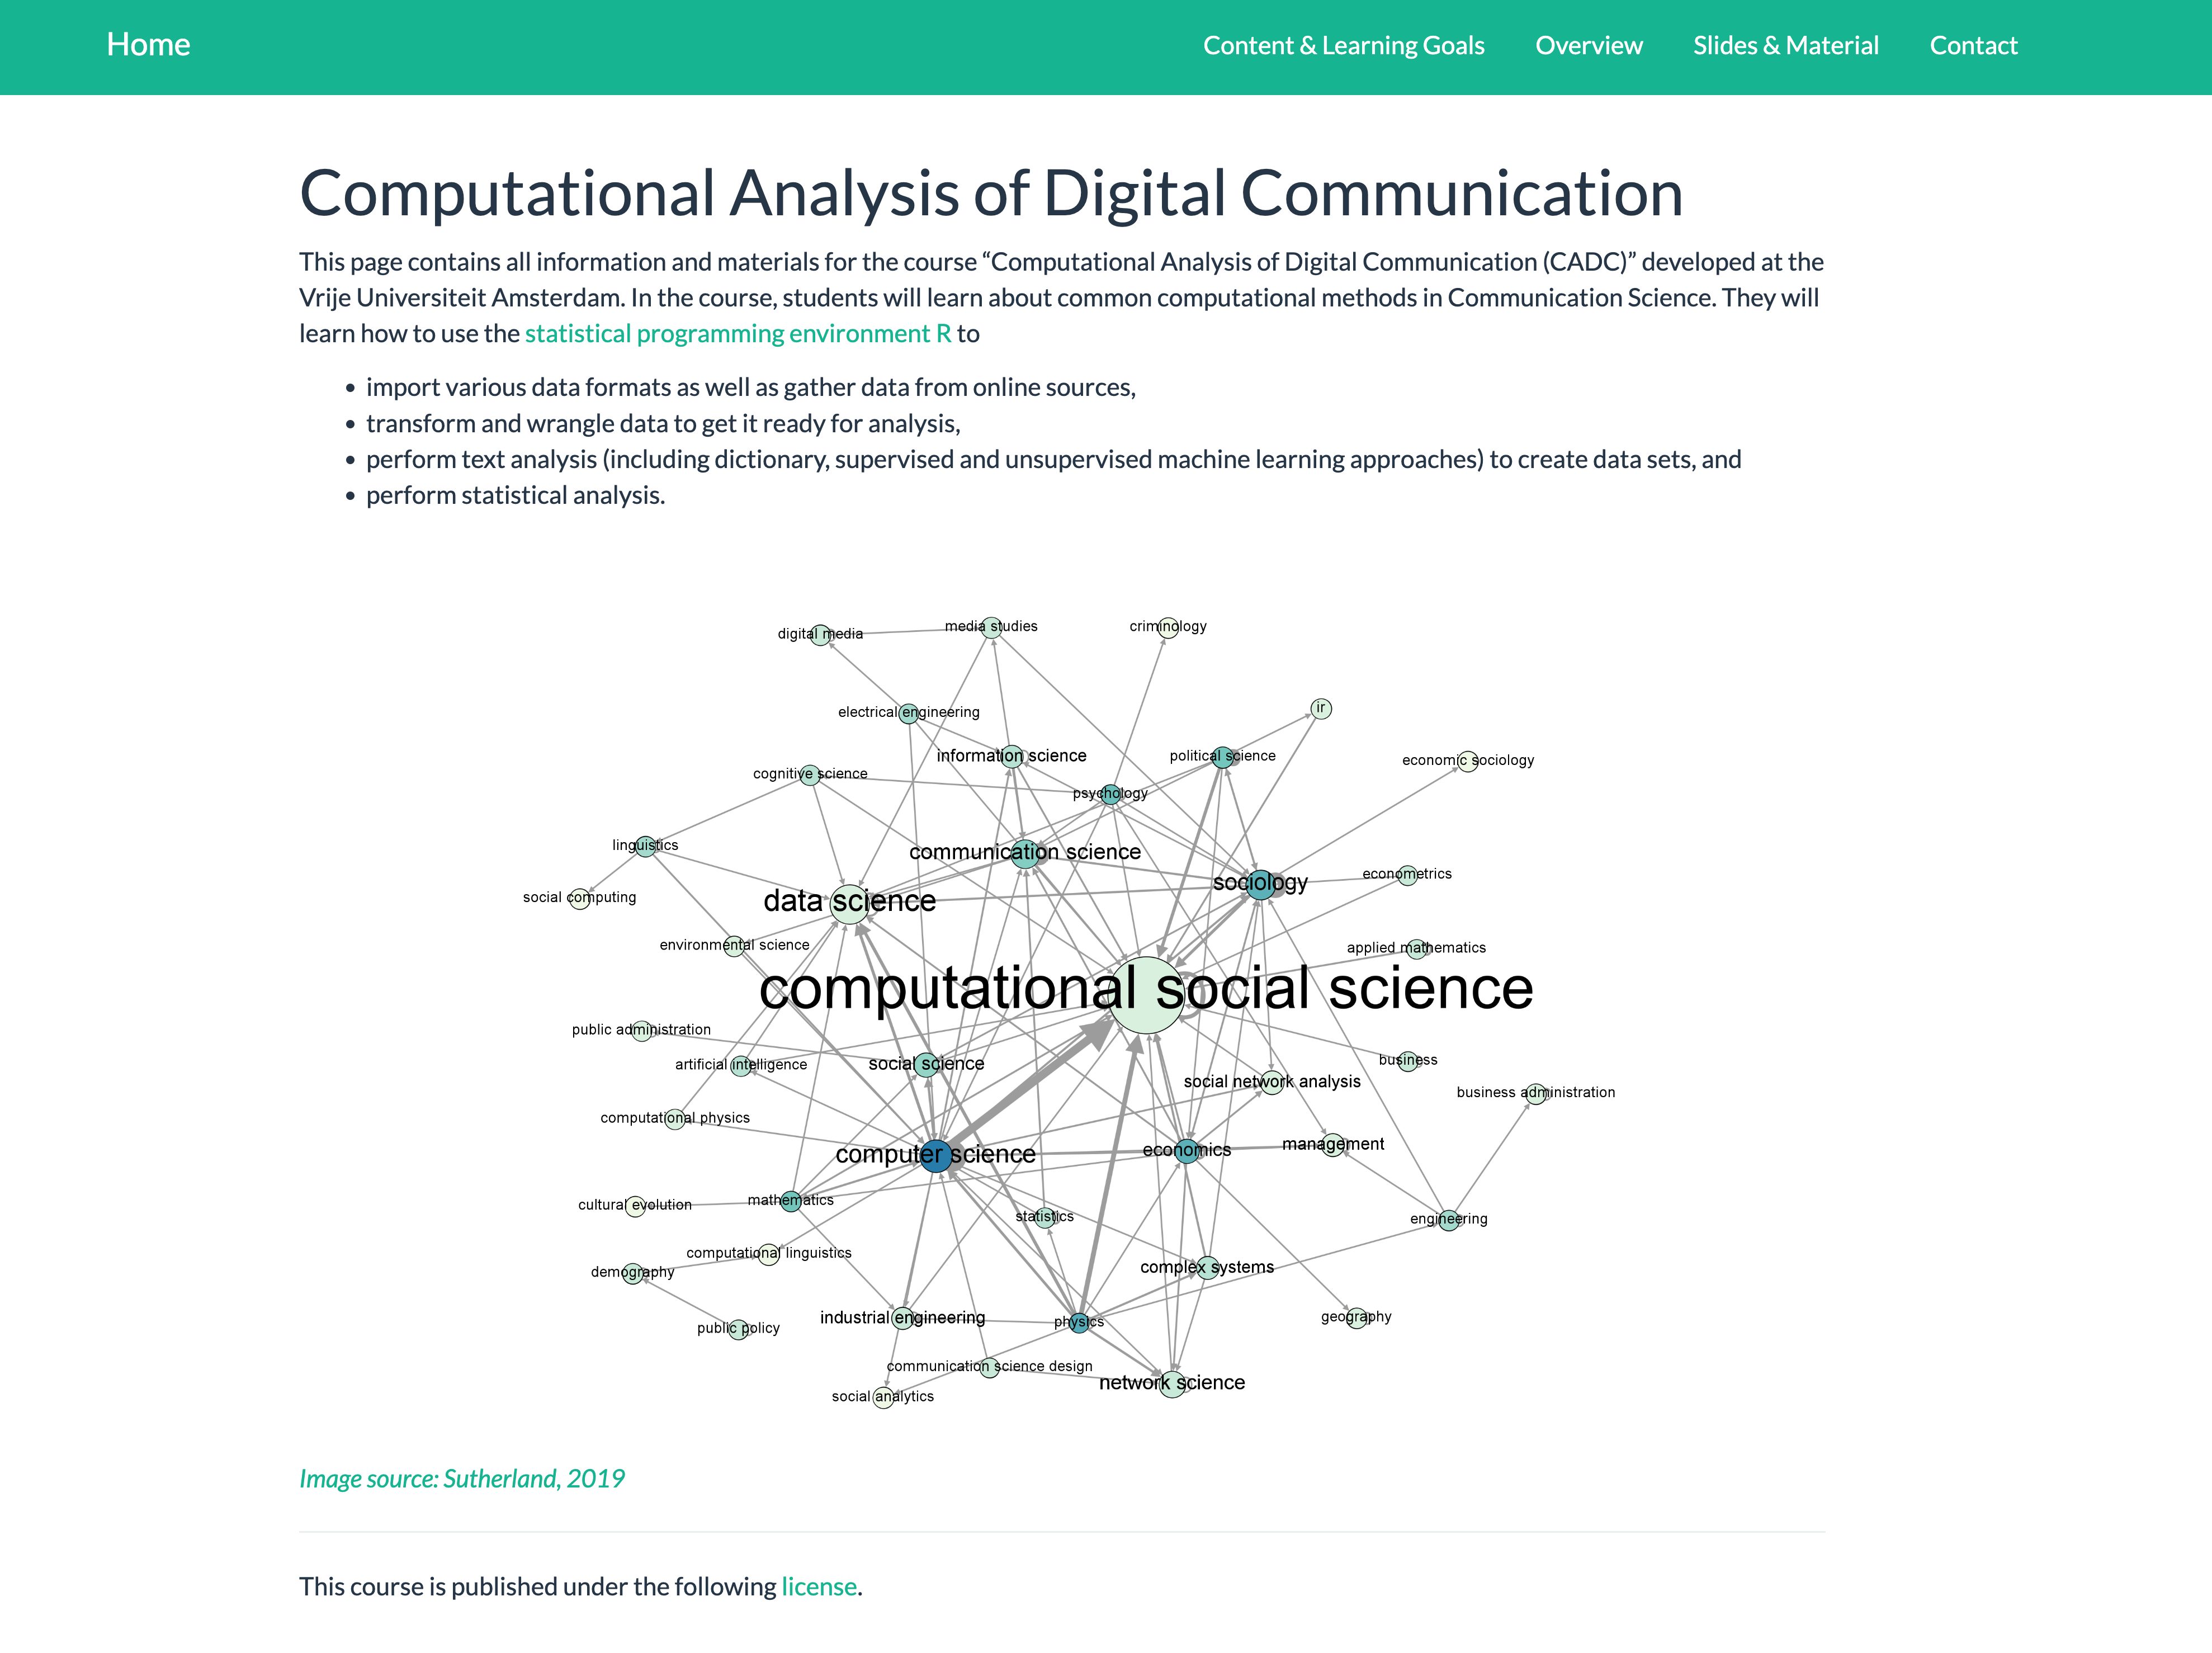
Computational Analysis of Digital Communication
Week 1: Introduction to Computational Methods in Communication Science
Increasing amount of data available online
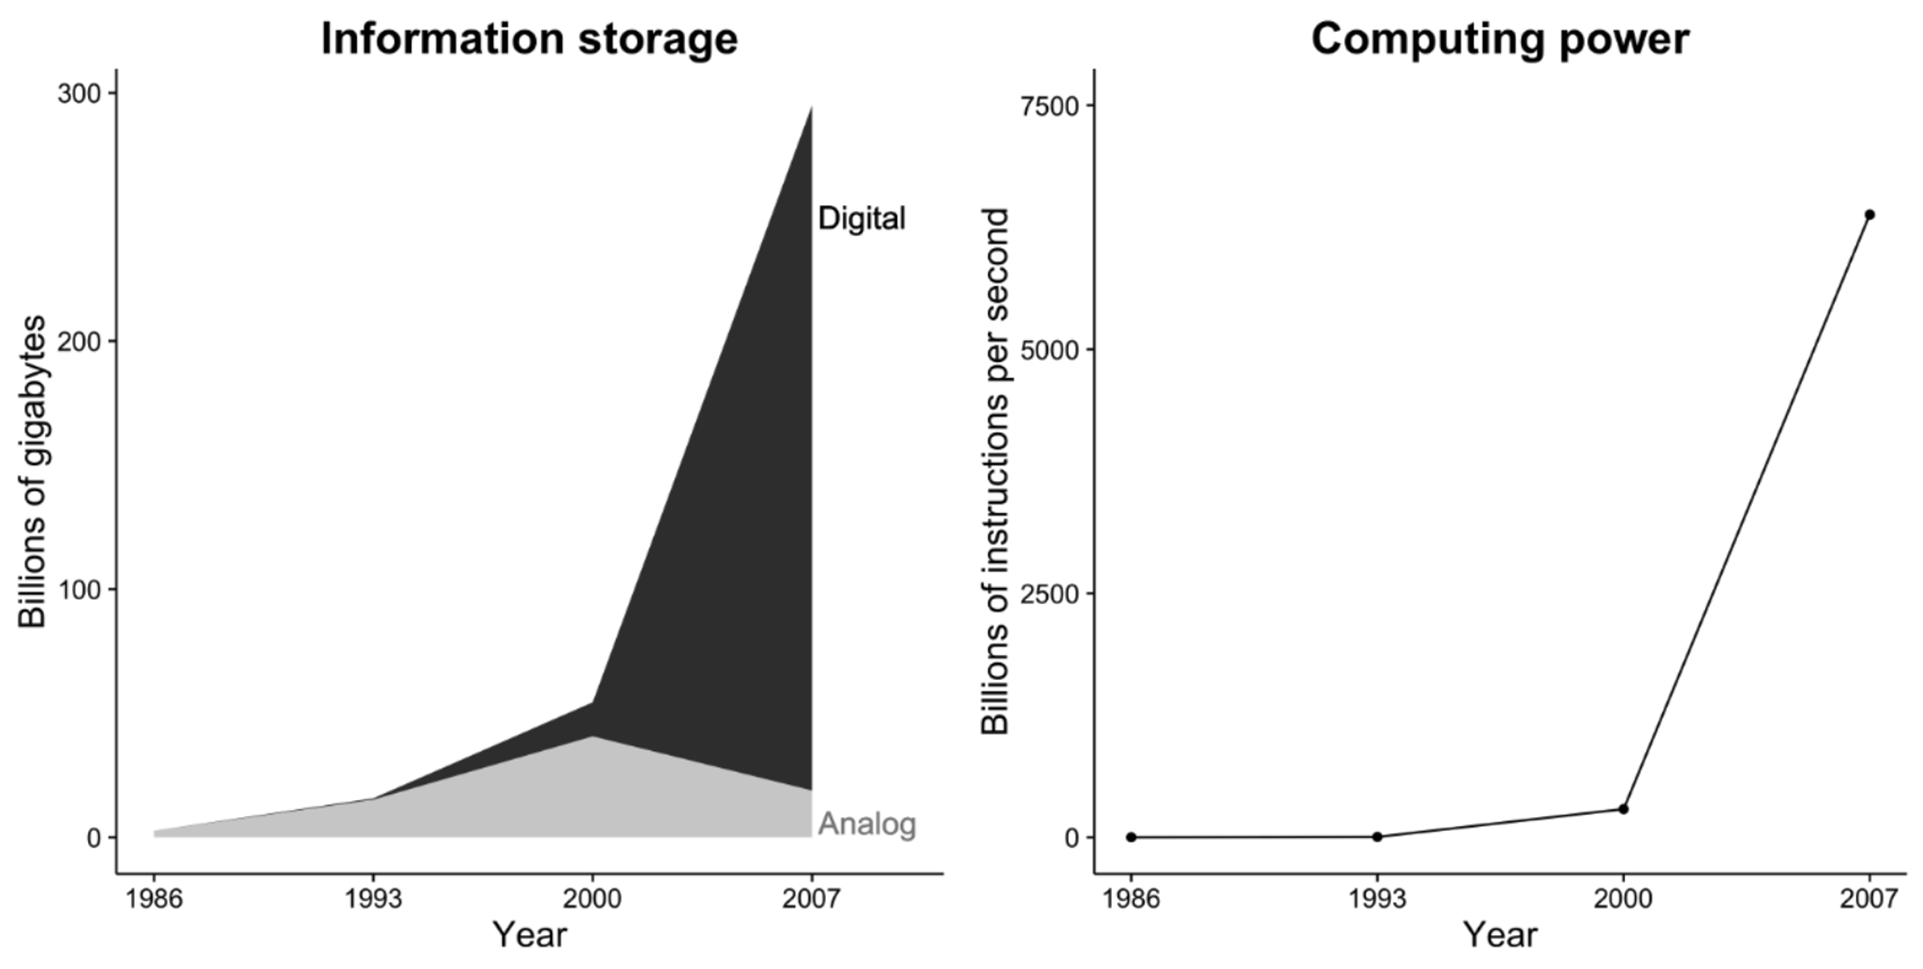
Hilbert & Lopez, 2011
Much of what we know about human behavior…
…is based on what people tell us:
- in self-report measures in surveys
- in responses in experimental research
- in qualitative interviews
Note: Although valuable, such measurements can be biased (Scharkow, 2013; Parry et al., 2021)!

But a lot of (mass) communication looks like this…

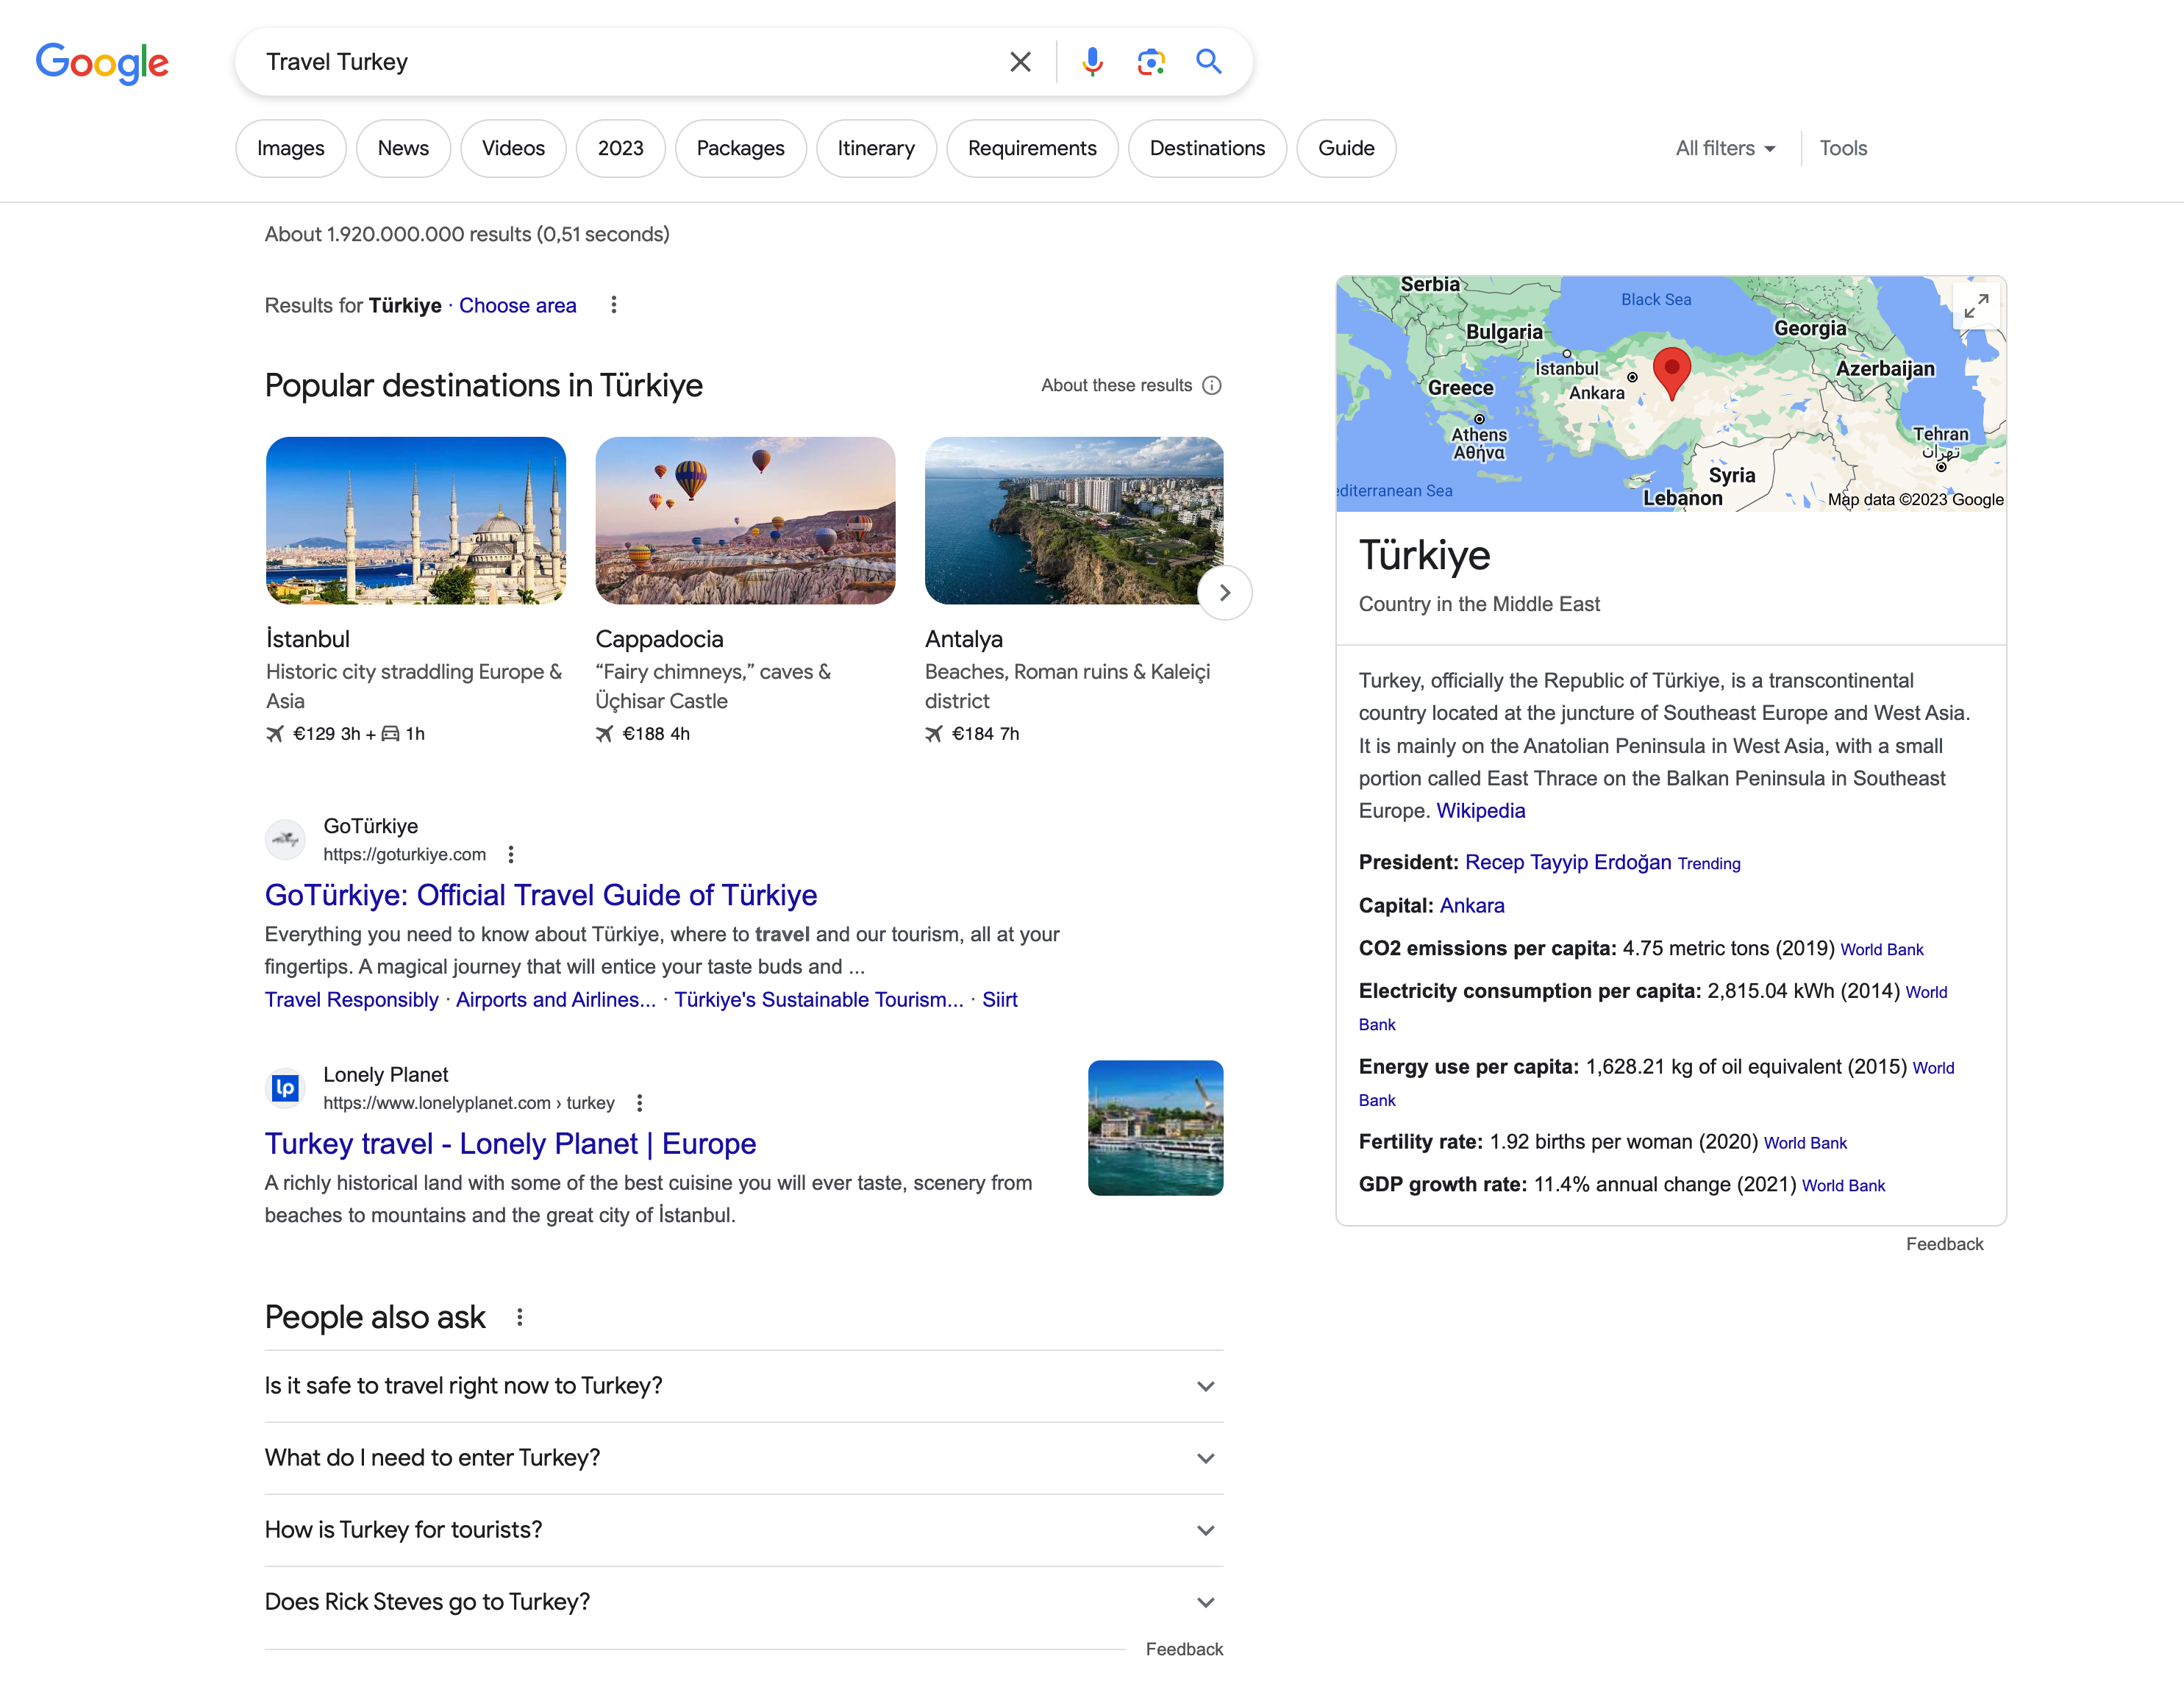

…or is based on user-generated content


Objectives and Learning goals
After completion of the course, you will…
be able to identify data analytic problems, analyze them critically, and find appropriate solutions
have a good understanding of the general text classification pipeline
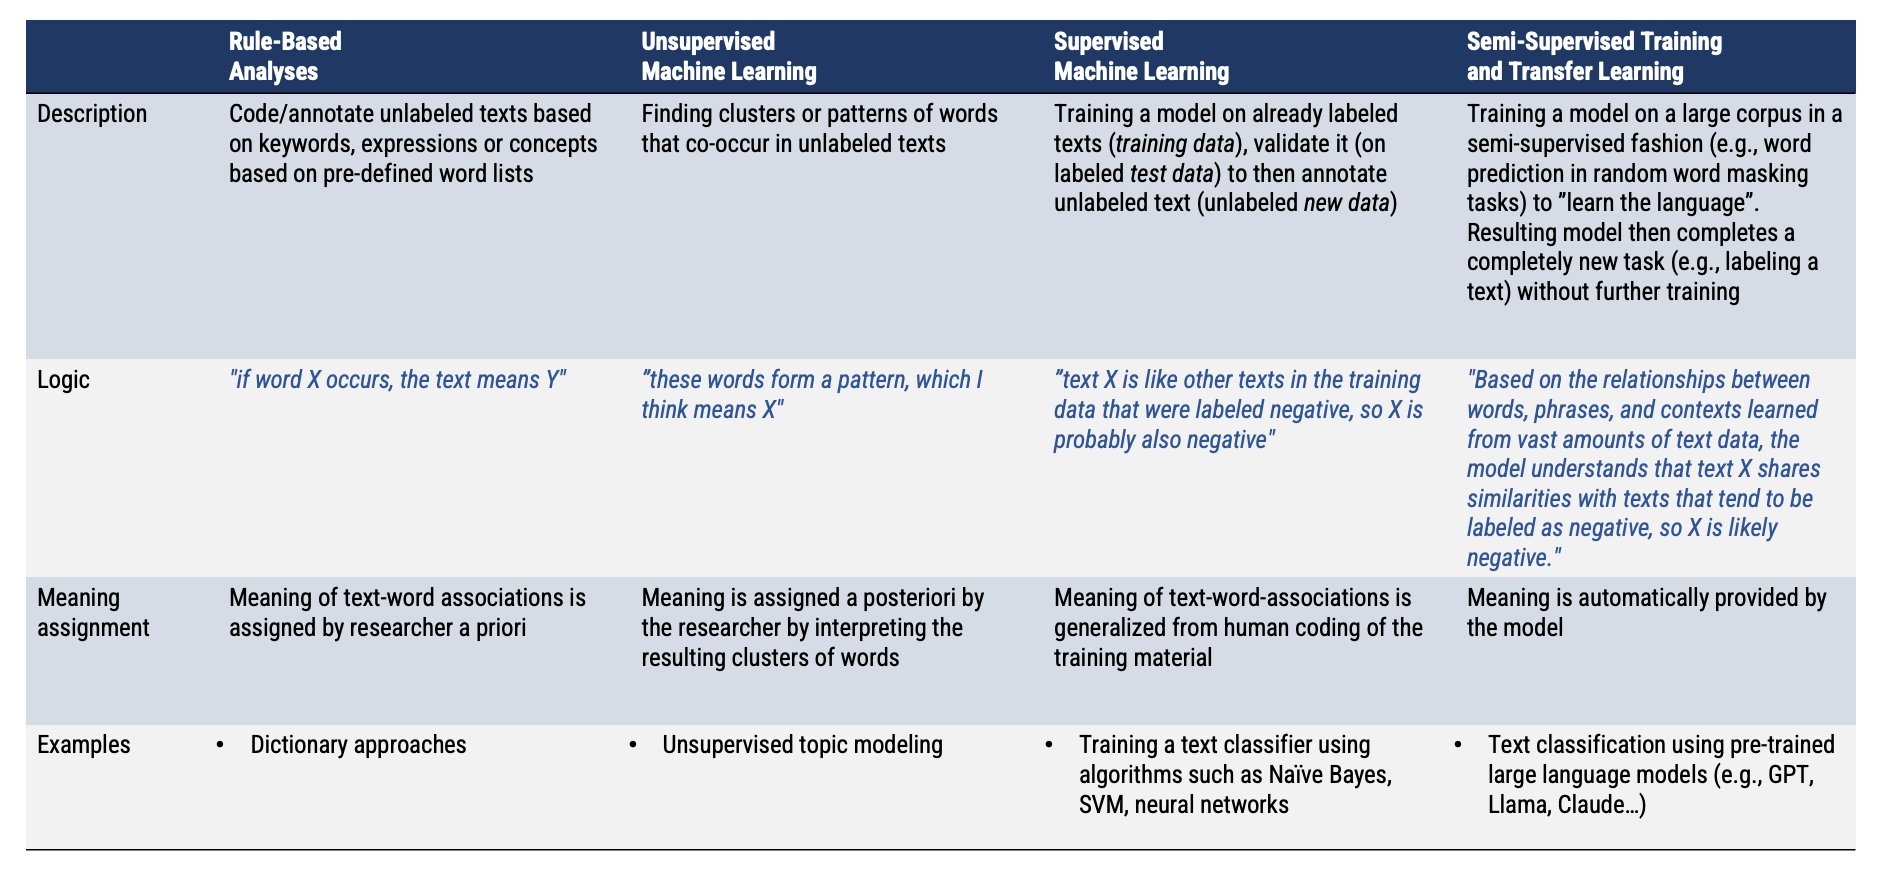
have practical knowledge about different approaches of text classification (incl. dictionary approaches, machine learning, large language models…)
Skills and methods
With regard to the specific methods being taught in R, you will be able to…
gather, scrape, and import data from different file types, APIs, and websites
link data from different sources to create new insights
clean and transform messy data into a tidy data format ready for text classification and analysis
use different approaches (e.g., dictionary, classic machine learning, transformer, LLMs) to extract information from textual data
perform statistical analyses on the substantive data
Who am I?
Assistant Professor of Communication Science
Research Interest
- Privacy & Data Protection Online
- Social Influence and Contagion
- Media Literacy
Methodological Interests
- Scale Development and Validation
- Bayesian Statistics
- Flexibility in Data Analysis
- Computational Methods and Machine Learning
More info: www.philippmasur.de

Definition
“Computational Communication Science (CCS) is the label applied to the emerging subfield that investigates the use of computational algorithms to gather and analyze big and often semi- or unstructured data sets to develop and test communication science theories”
Van Atteveldt & Peng, 2018

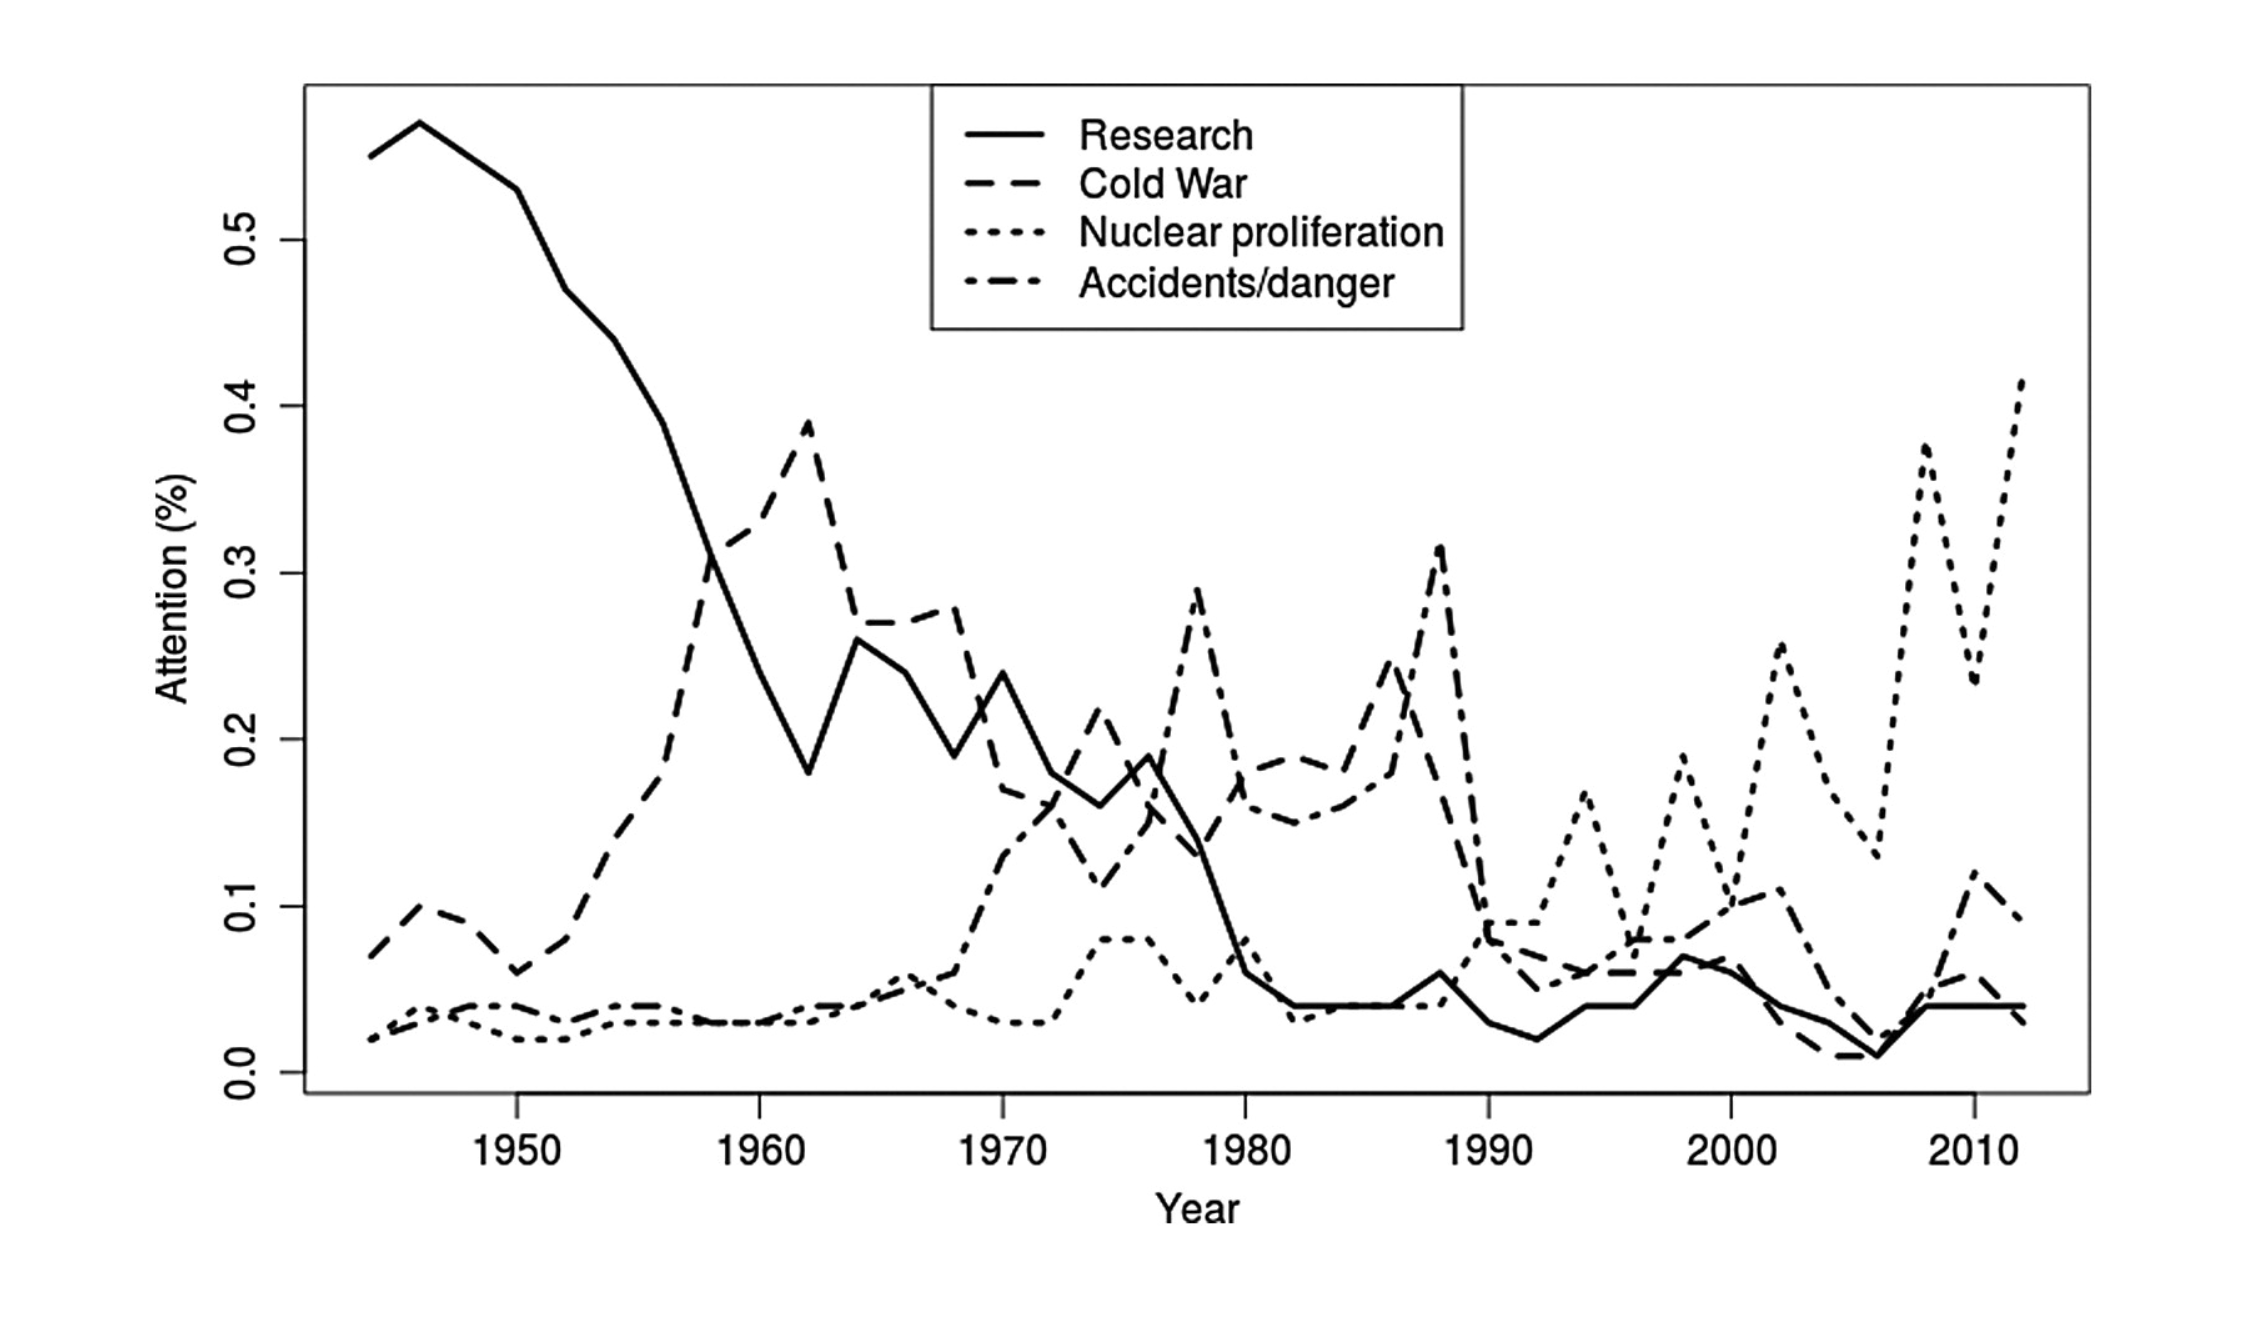
Example 1: Analyzing News Coverage
Jacobi and colleagues (2016) analyzed the coverage of nuclear technology from 1945 to 2014 in the New York Times
Analysis of 51,528 news stories (headline and lead): Way too much for human coding!
Used “LDA topic modeling” to extract latent topics and analyzed their occurrence over time
Example 2: Facebook Data to Predict Personality
Kosinski and colleagues (2013) used a dataset of over 58,000 volunteers who provided their Facebook Likes, detailed demographic profiles, and the results of several psychometric test
Were able to show that one can predict a variety of personal characteristics and personality traits from simple Facebook likes


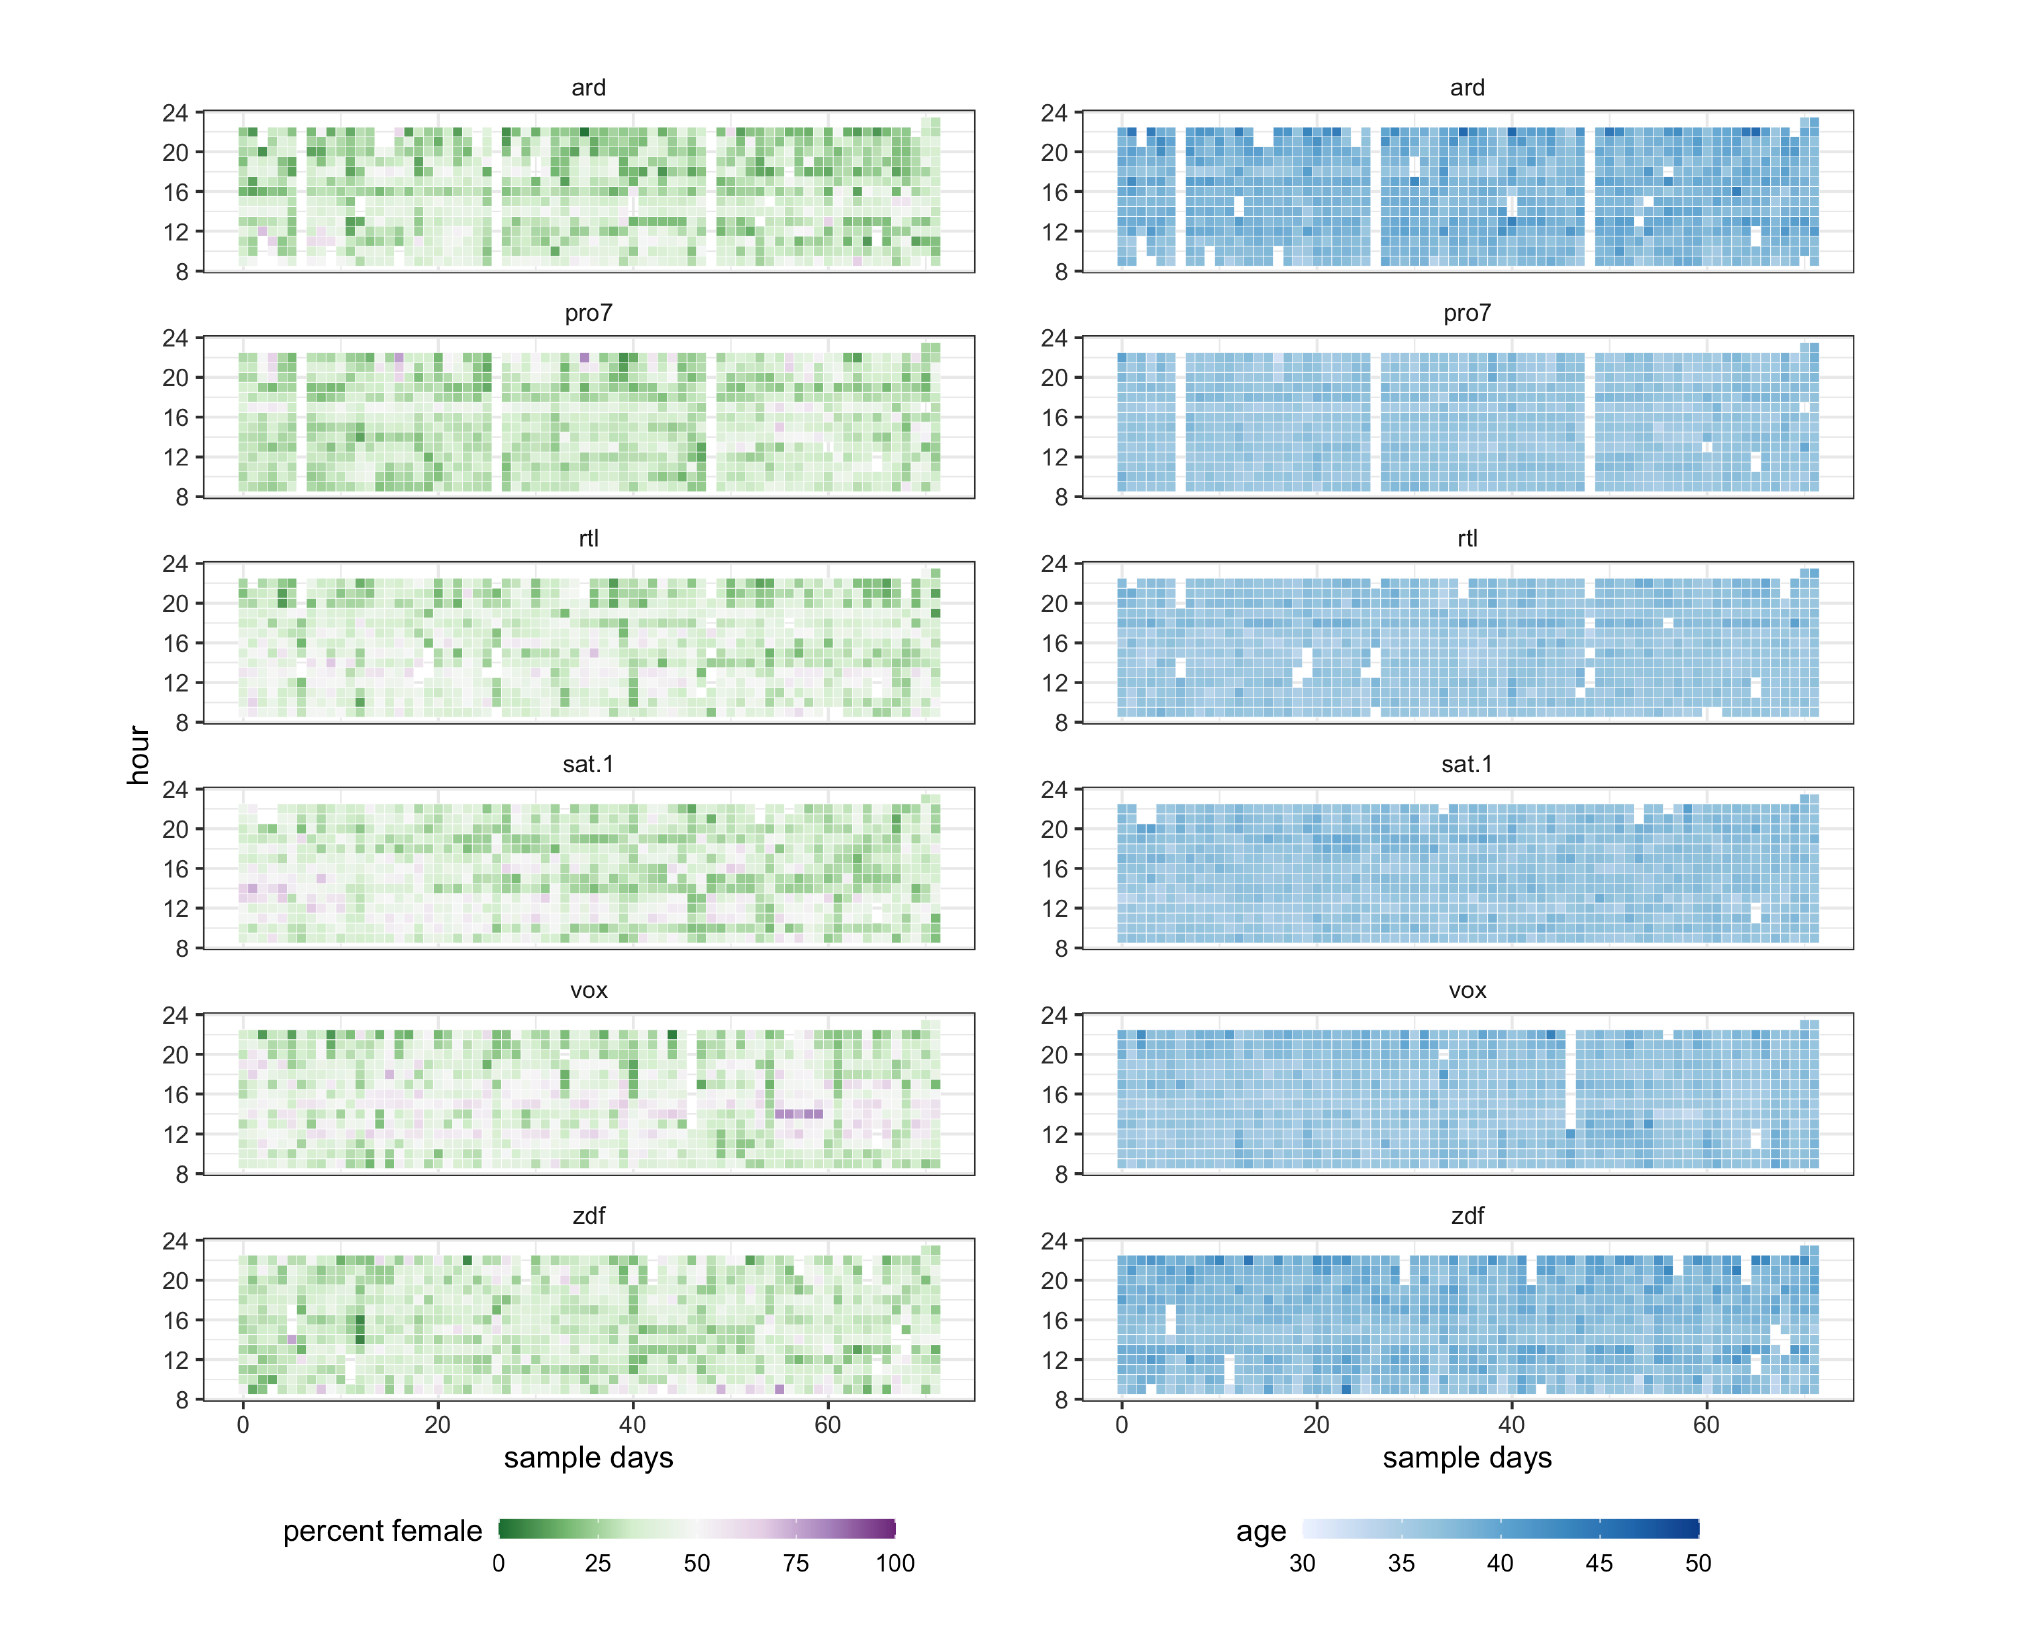
Example 3: Gender representation in TV
Women on average remained underrepresented on TV, with 6.3 million female faces out of 16 million total (estimated proportion .39, 95% CI: .37-.42)
This strong overall bias was mirrored across specific subsamples (news, sports, advertising…)
Traditional text analysis
Choosing the texts that contain the content and one wants to analyze (1)
Define the units and categories of analysis (2) & (3)
Describe categories and develop a set of rules for the manual coding process (4)
Coding the text according to the rules (5), which usually requires a lot of manual work
Make sense of codes (6) and rework the codes and rules (7) and redo the analysis
Analyze frequencies, relationships, differences, similarities between units/codes

Problem: Requires a lot of work and there are always more texts than humans can possibly code manually!
Definition
Text analysis is “a research technique for making replicable and valid inferences from texts (or other meaningful matter) to the contexts of their use”
Krippendorff, 2004
What is text?


But text can also look very different
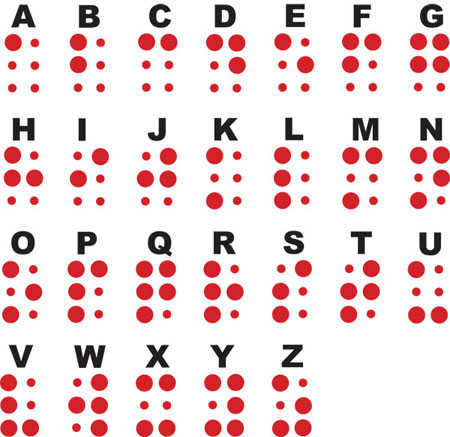
Symbols and Meaning

Text consists of symbols
Symbols by themselves do not have meaning
A symbol itself is a mark, sign, or word that indicates,
signifies, or is understood as representing an idea,
object, or relationshipSymbols thereby allow people to go beyond what is
known or seen by creating linkages between otherwise
very different concepts and experiencesText (a collection of symbols) only attains meaning
when interpreted (in its context)Main challenge in Automatic Text Analysis:
Bridge the gap from symbols to meaningful
interpretation
Understanding language
“As natural language processing (NLP) practitioners, we bring our assumptions about what language is and how language works into the task of creating modeling features from natural language and using those features as inputs to statistical models. This is true even when we don’t think about how language works very deeply or when our understanding is unsophisticated or inaccurate […] We can improve our machine learning models for text by heightening that knowledge.”
Hvitfeldt & Silge, 2021
From text to numbers
In automated text classification, we use understandings of morphology (and other fields of linguistics) to break text into tokens and then represent these tokens as numbers, so that a computer can read them:
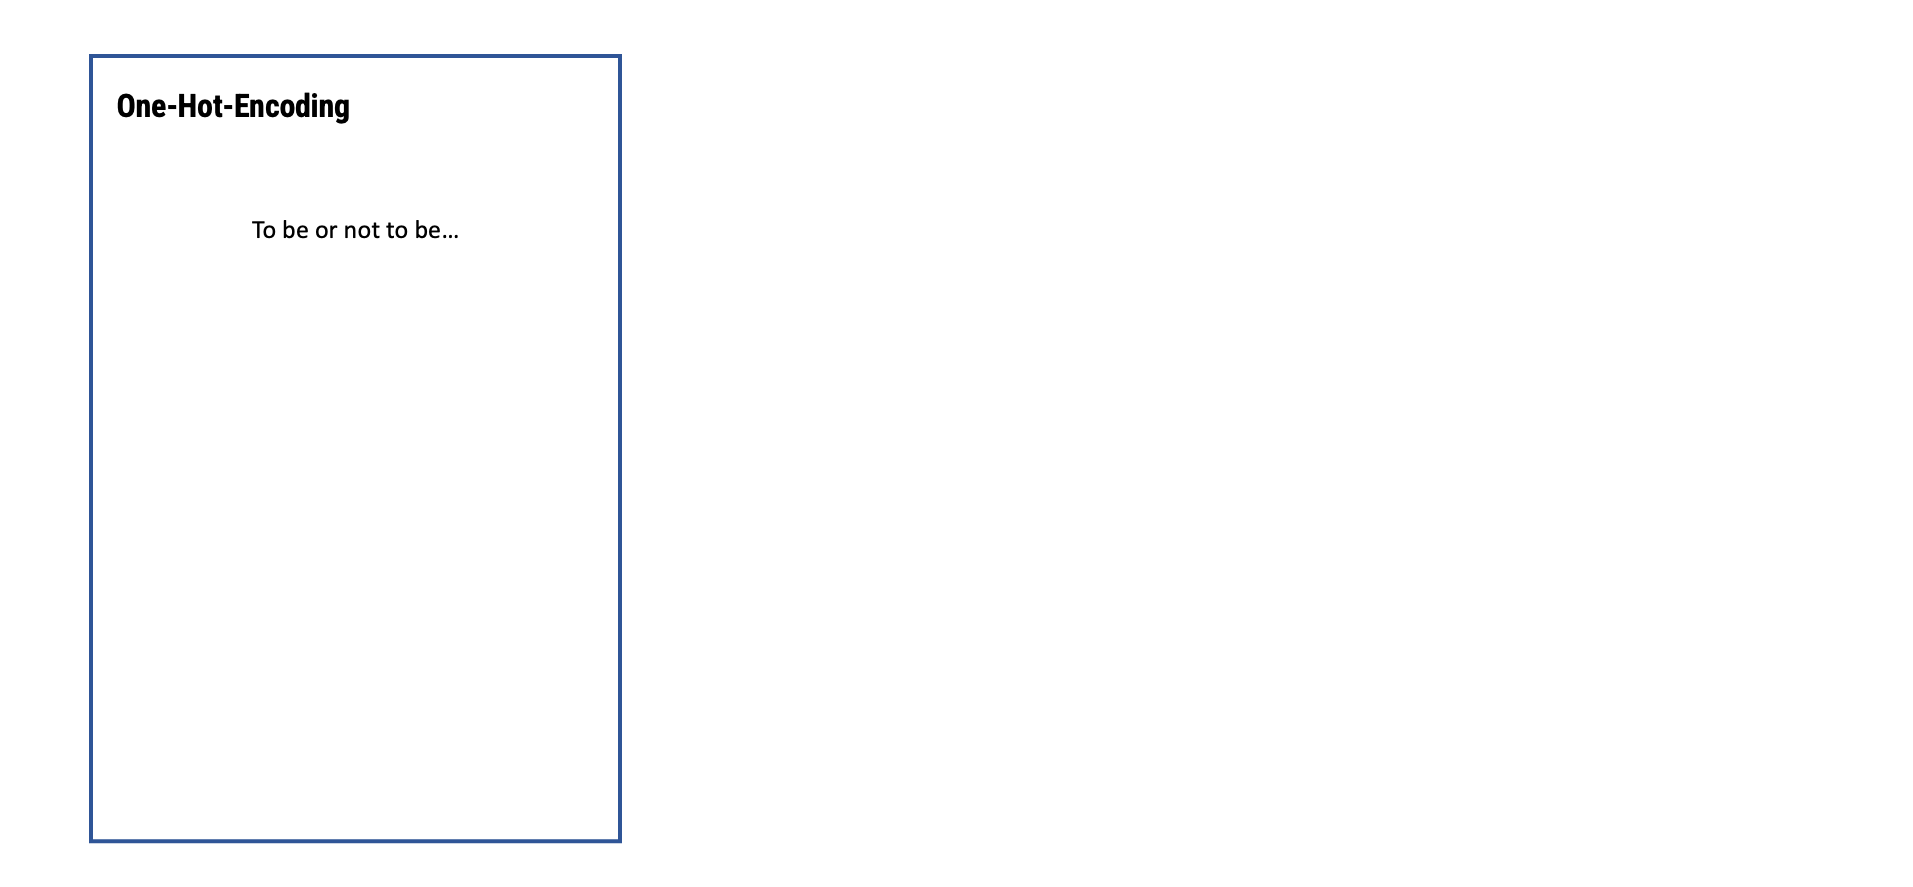
From text to numbers
In automated text classification, we use understandings of morphology (and other fields of linguistics) to break text into tokens and then represent these tokens as numbers, so that a computer can read them:
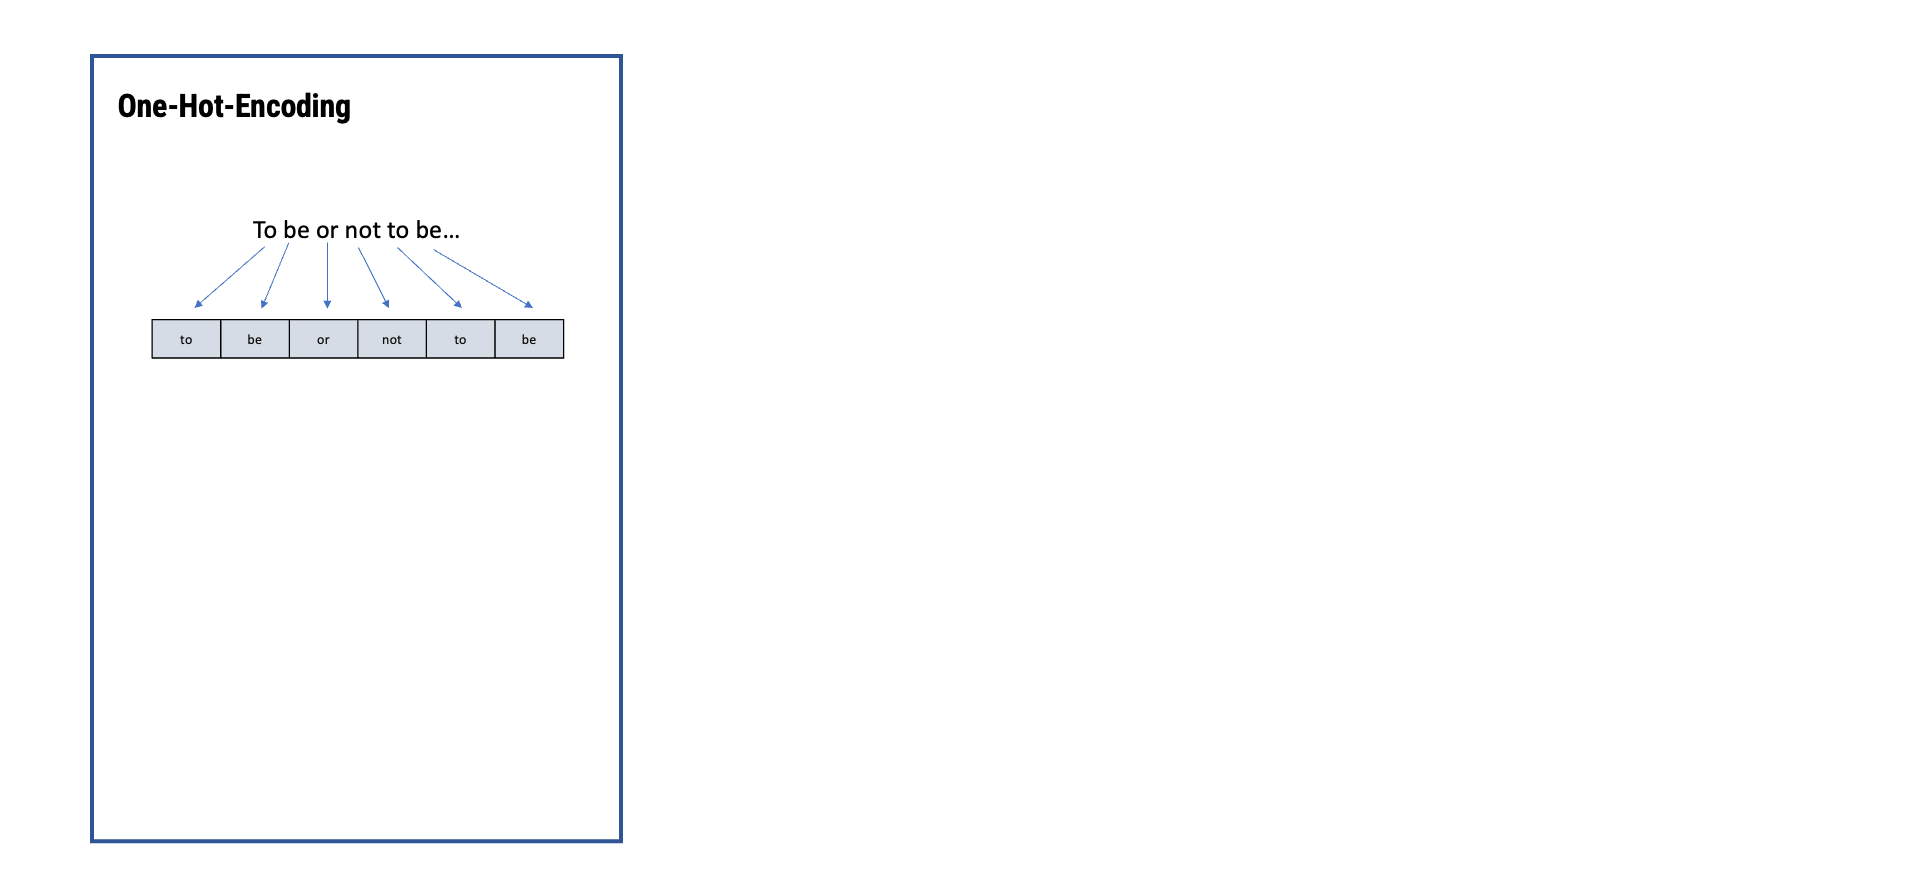
From text to numbers
In automated text classification, we use understandings of morphology (and other fields of linguistics) to break text into tokens and then represent these tokens as numbers, so that a computer can read them:

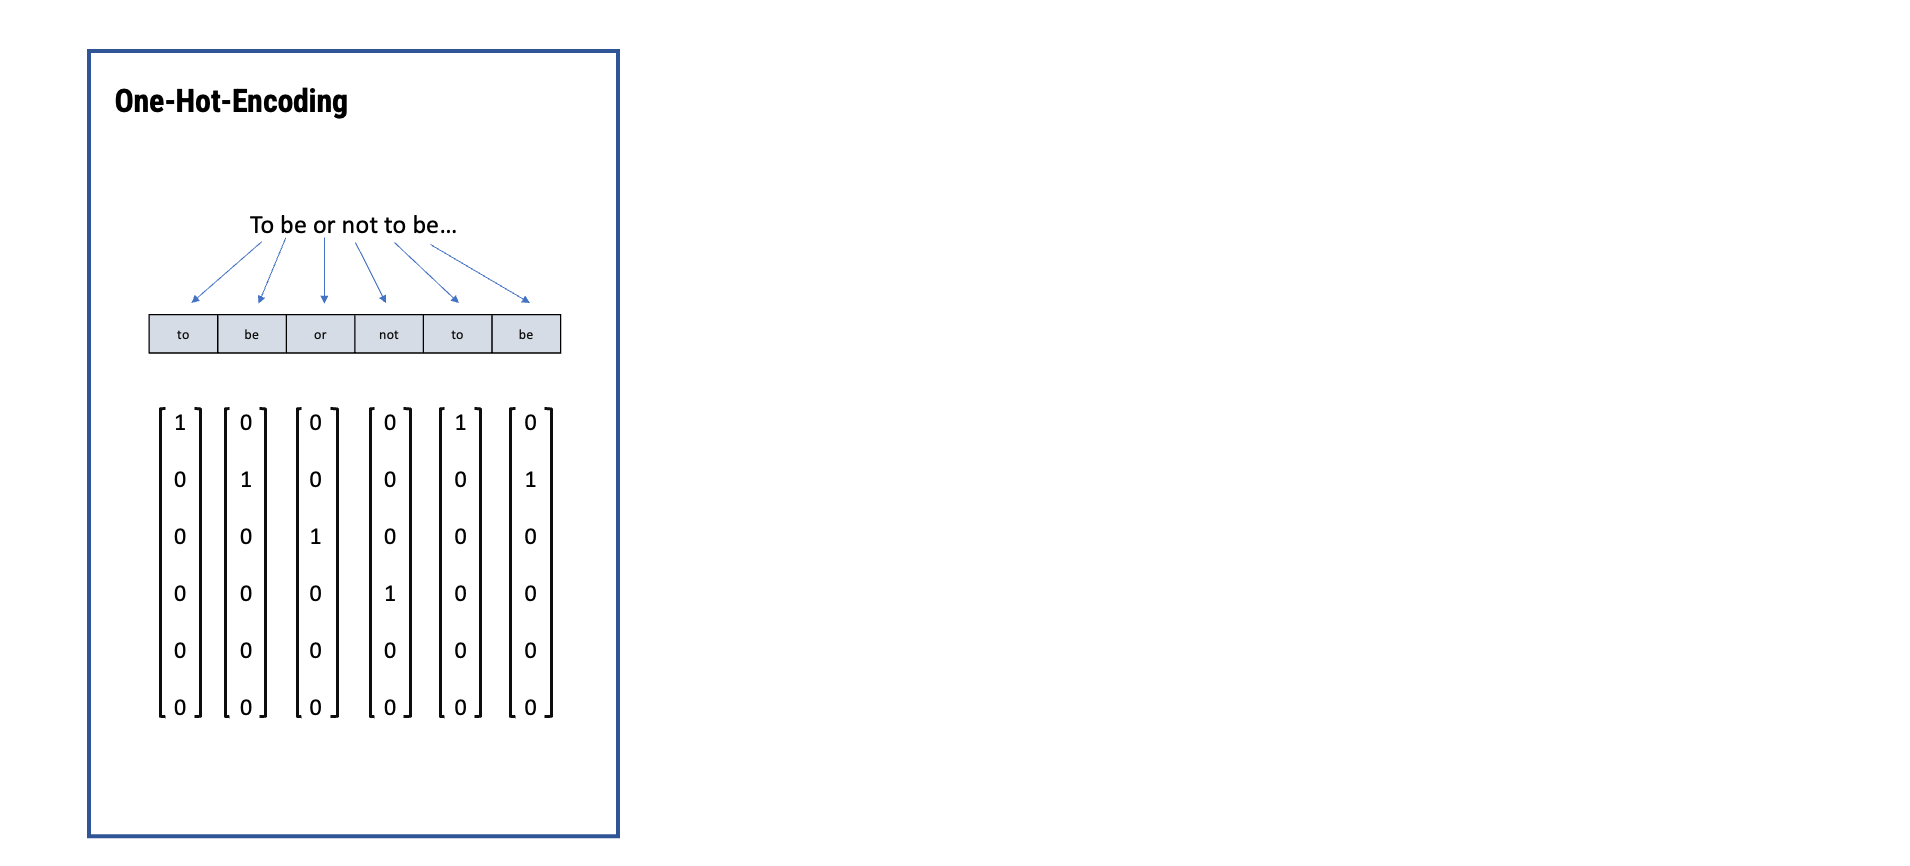
From text to numbers
In automated text classification, we use understandings of morphology (and other fields of linguistics) to break text into tokens and then represent these tokens as numbers, so that a computer can read them:

From text to numbers
In automated text classification, we use understandings of morphology (and other fields of linguistics) to break text into tokens and then represent these tokens as numbers, so that a computer can read them:
From text to numbers
In automated text classification, we use understandings of morphology (and other fields of linguistics) to break text into tokens and then represent these tokens as numbers, so that a computer can read them:

From text to numbers
In automated text classification, we use understandings of morphology (and other fields of linguistics) to break text into tokens and then represent these tokens as numbers, so that a computer can read them:
General Text Classification Pipeline
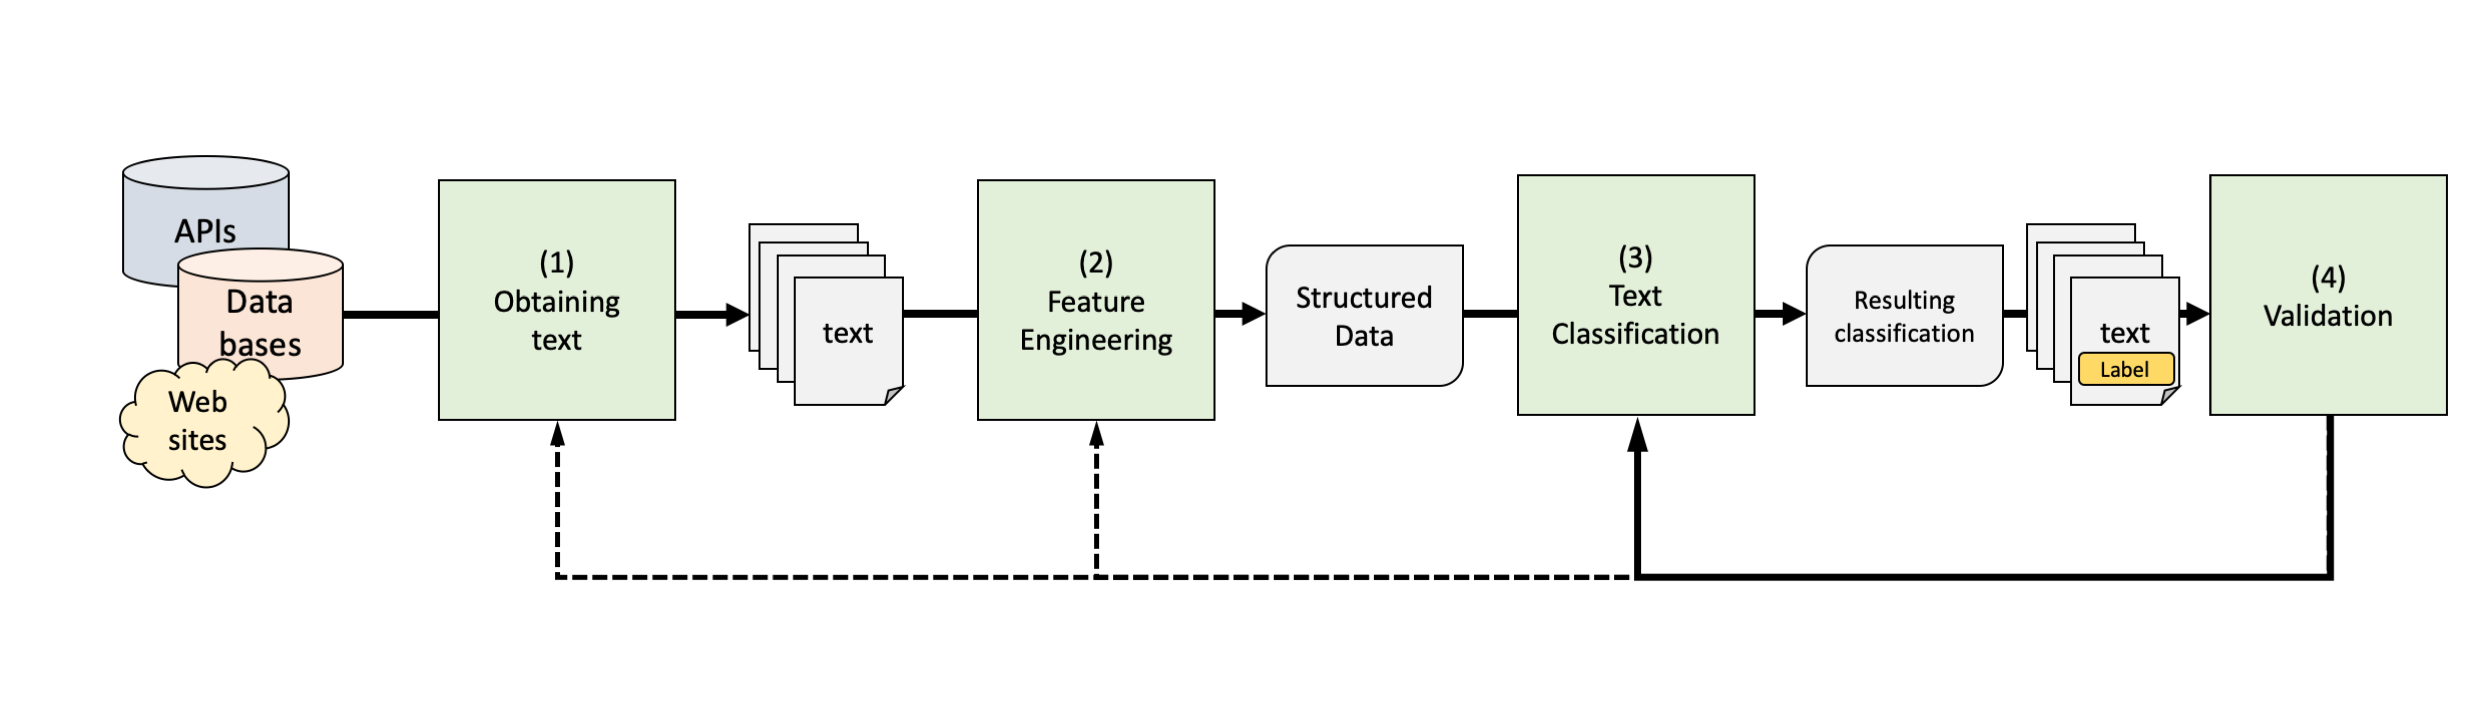
General Goal: to label (or annotate) previously unlabeled text
- Entails labeling a sentence, paragraph, or entire text (e.g., with the topic, the sentiment,…)
- Specific methods may differ, but the necessary steps (1-4) usually remain the same
We will always come back to this general pipeline to make sure we understand the core principles and goals
(1) Obtaining text
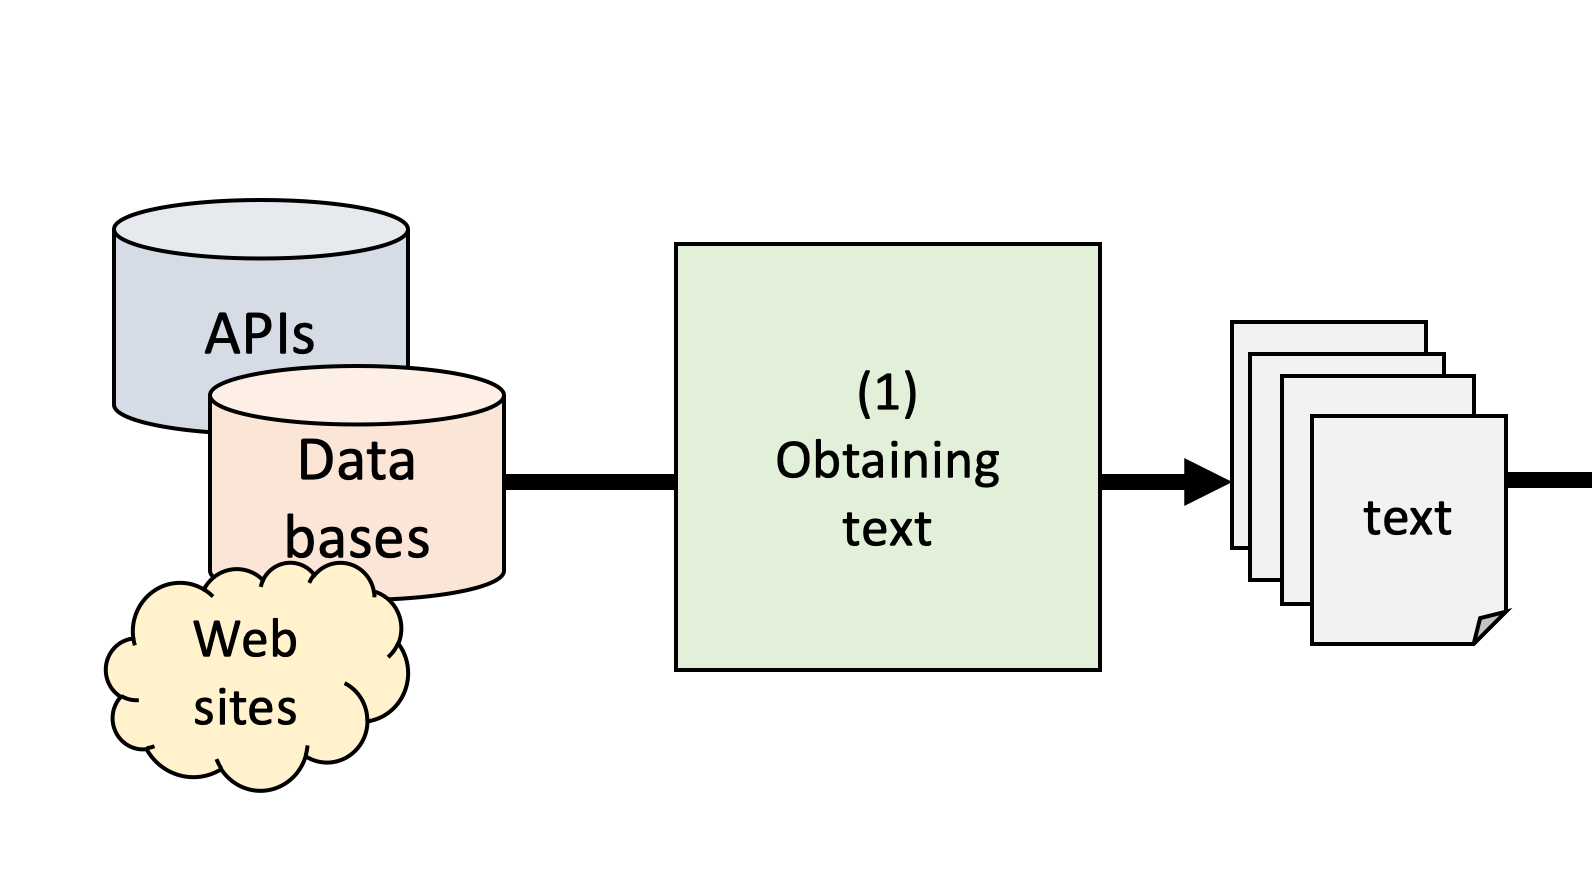
From publicly available data sets
- e.g.: Political texts, news from publisher / library
- Great if you can find it, often not available
By scraping primary sources
- e.g.: Press releases from party website, existing archives
- Writing scrapers can be trivial or very complex depending on web site
- Make sure to check legal issues
Via proprietary texts from third parties
- e.g.: digital archives (LexisNexis, factiva etc.), social media APIs
- Often custom format, API restrictions, API changes
- Terms of use not conducive to research, sharing
(2) Feature engineering
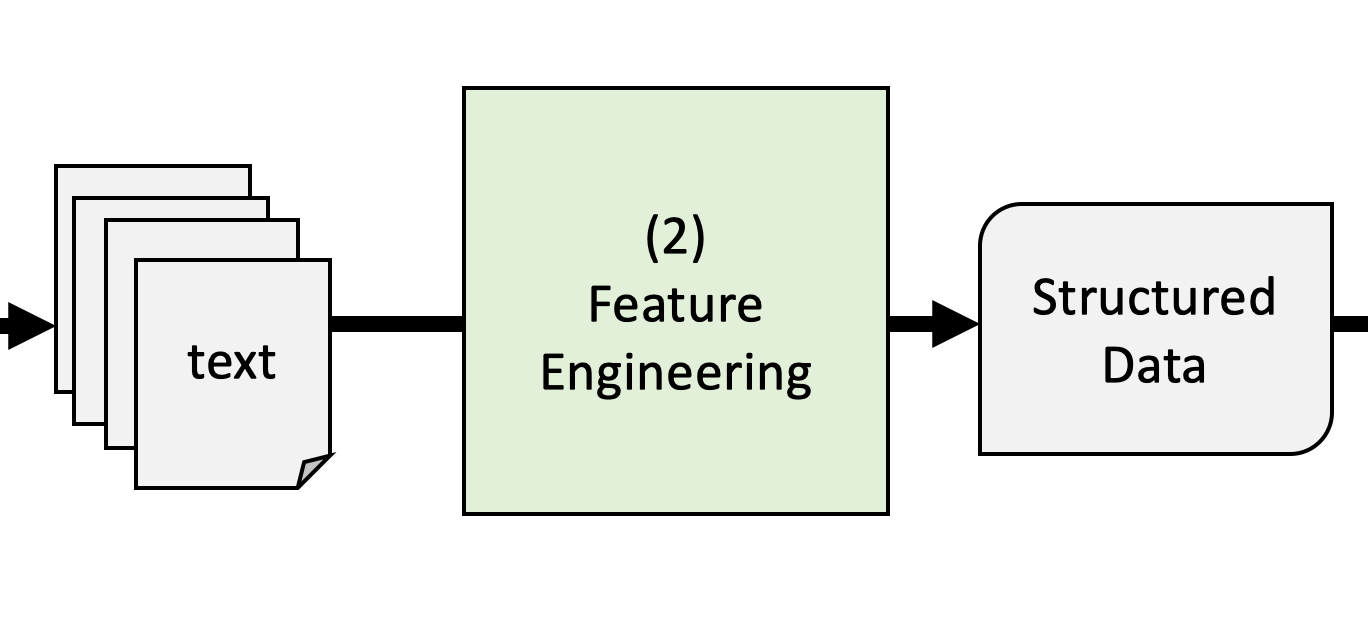
Feature engineering is the process of selecting, manipulating,
and transforming raw data into so-called featuresWhat type of feature engineering is necessary or useful
strongly depends on the method used, but may include- feature creation: breaking down text into the features that we want to analyze (so-called tokens such as words, sentence, bi-grams…)
- feature transformation: involves text cleaning such as stopword removal, stemming, normalization
- feature selection: frequency trimming
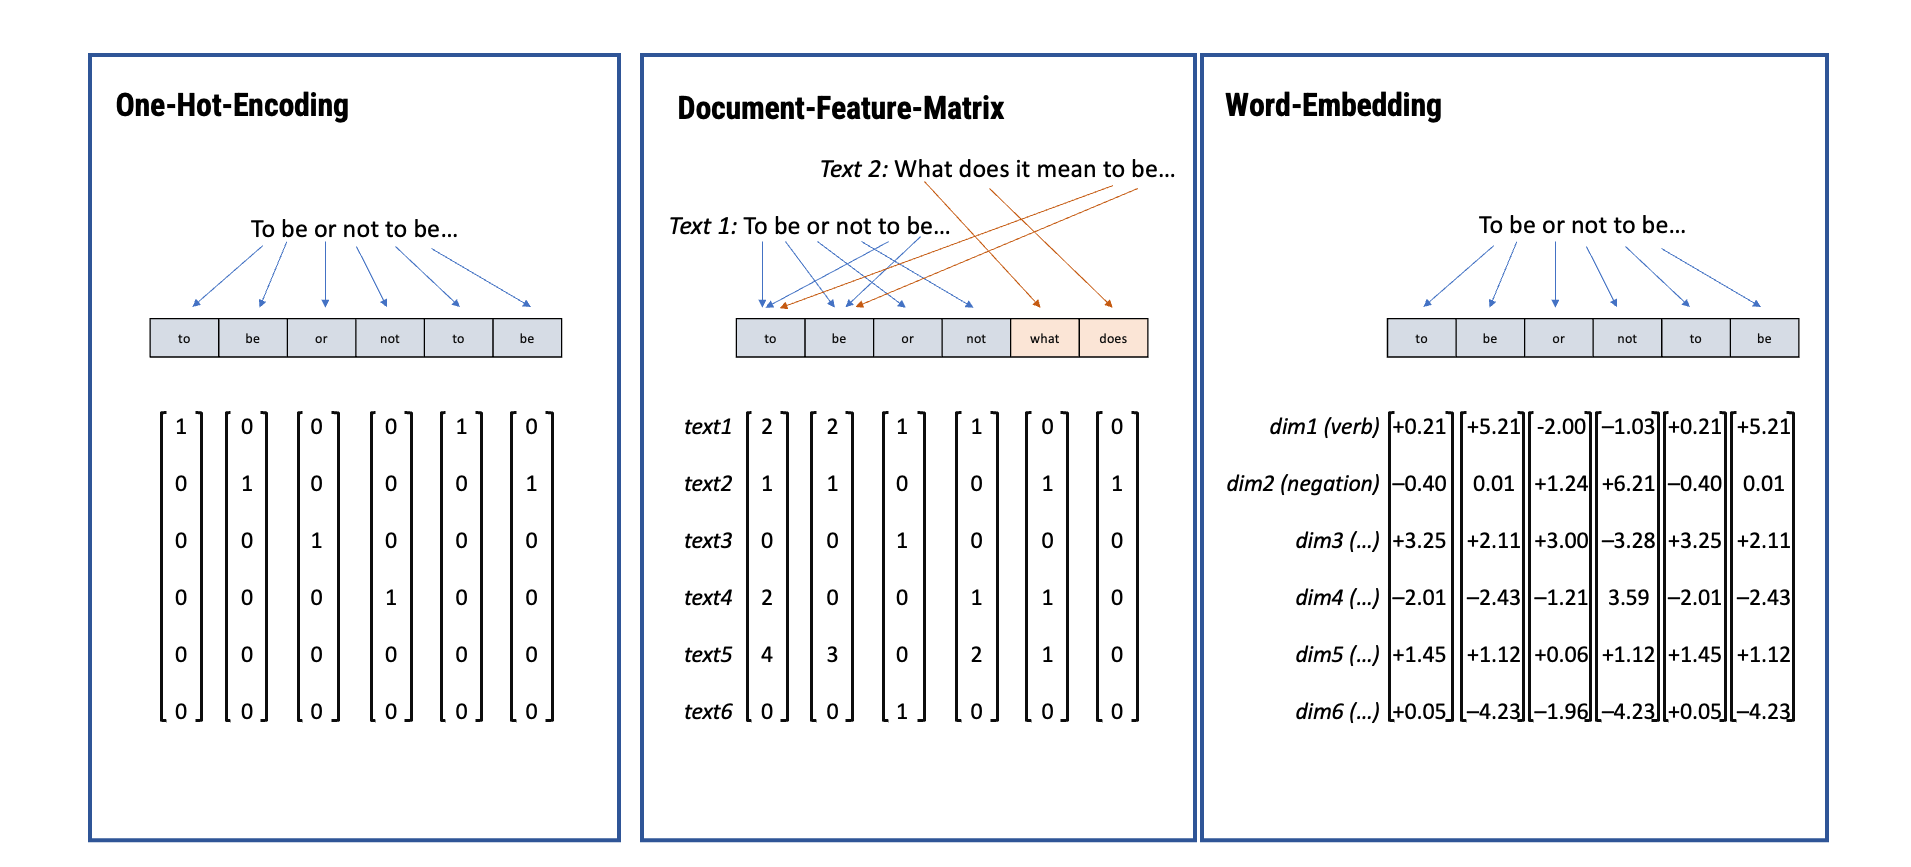
- creation of structured data: translating tokens into vectors or numbers (e.g., a document-feature matrix for classic ML approaches or dense vector-matrices for deep learning
Modern approaches such require less and less manual feature engineering and at times, make it entirely obsolete (because these models automatically “do it”)
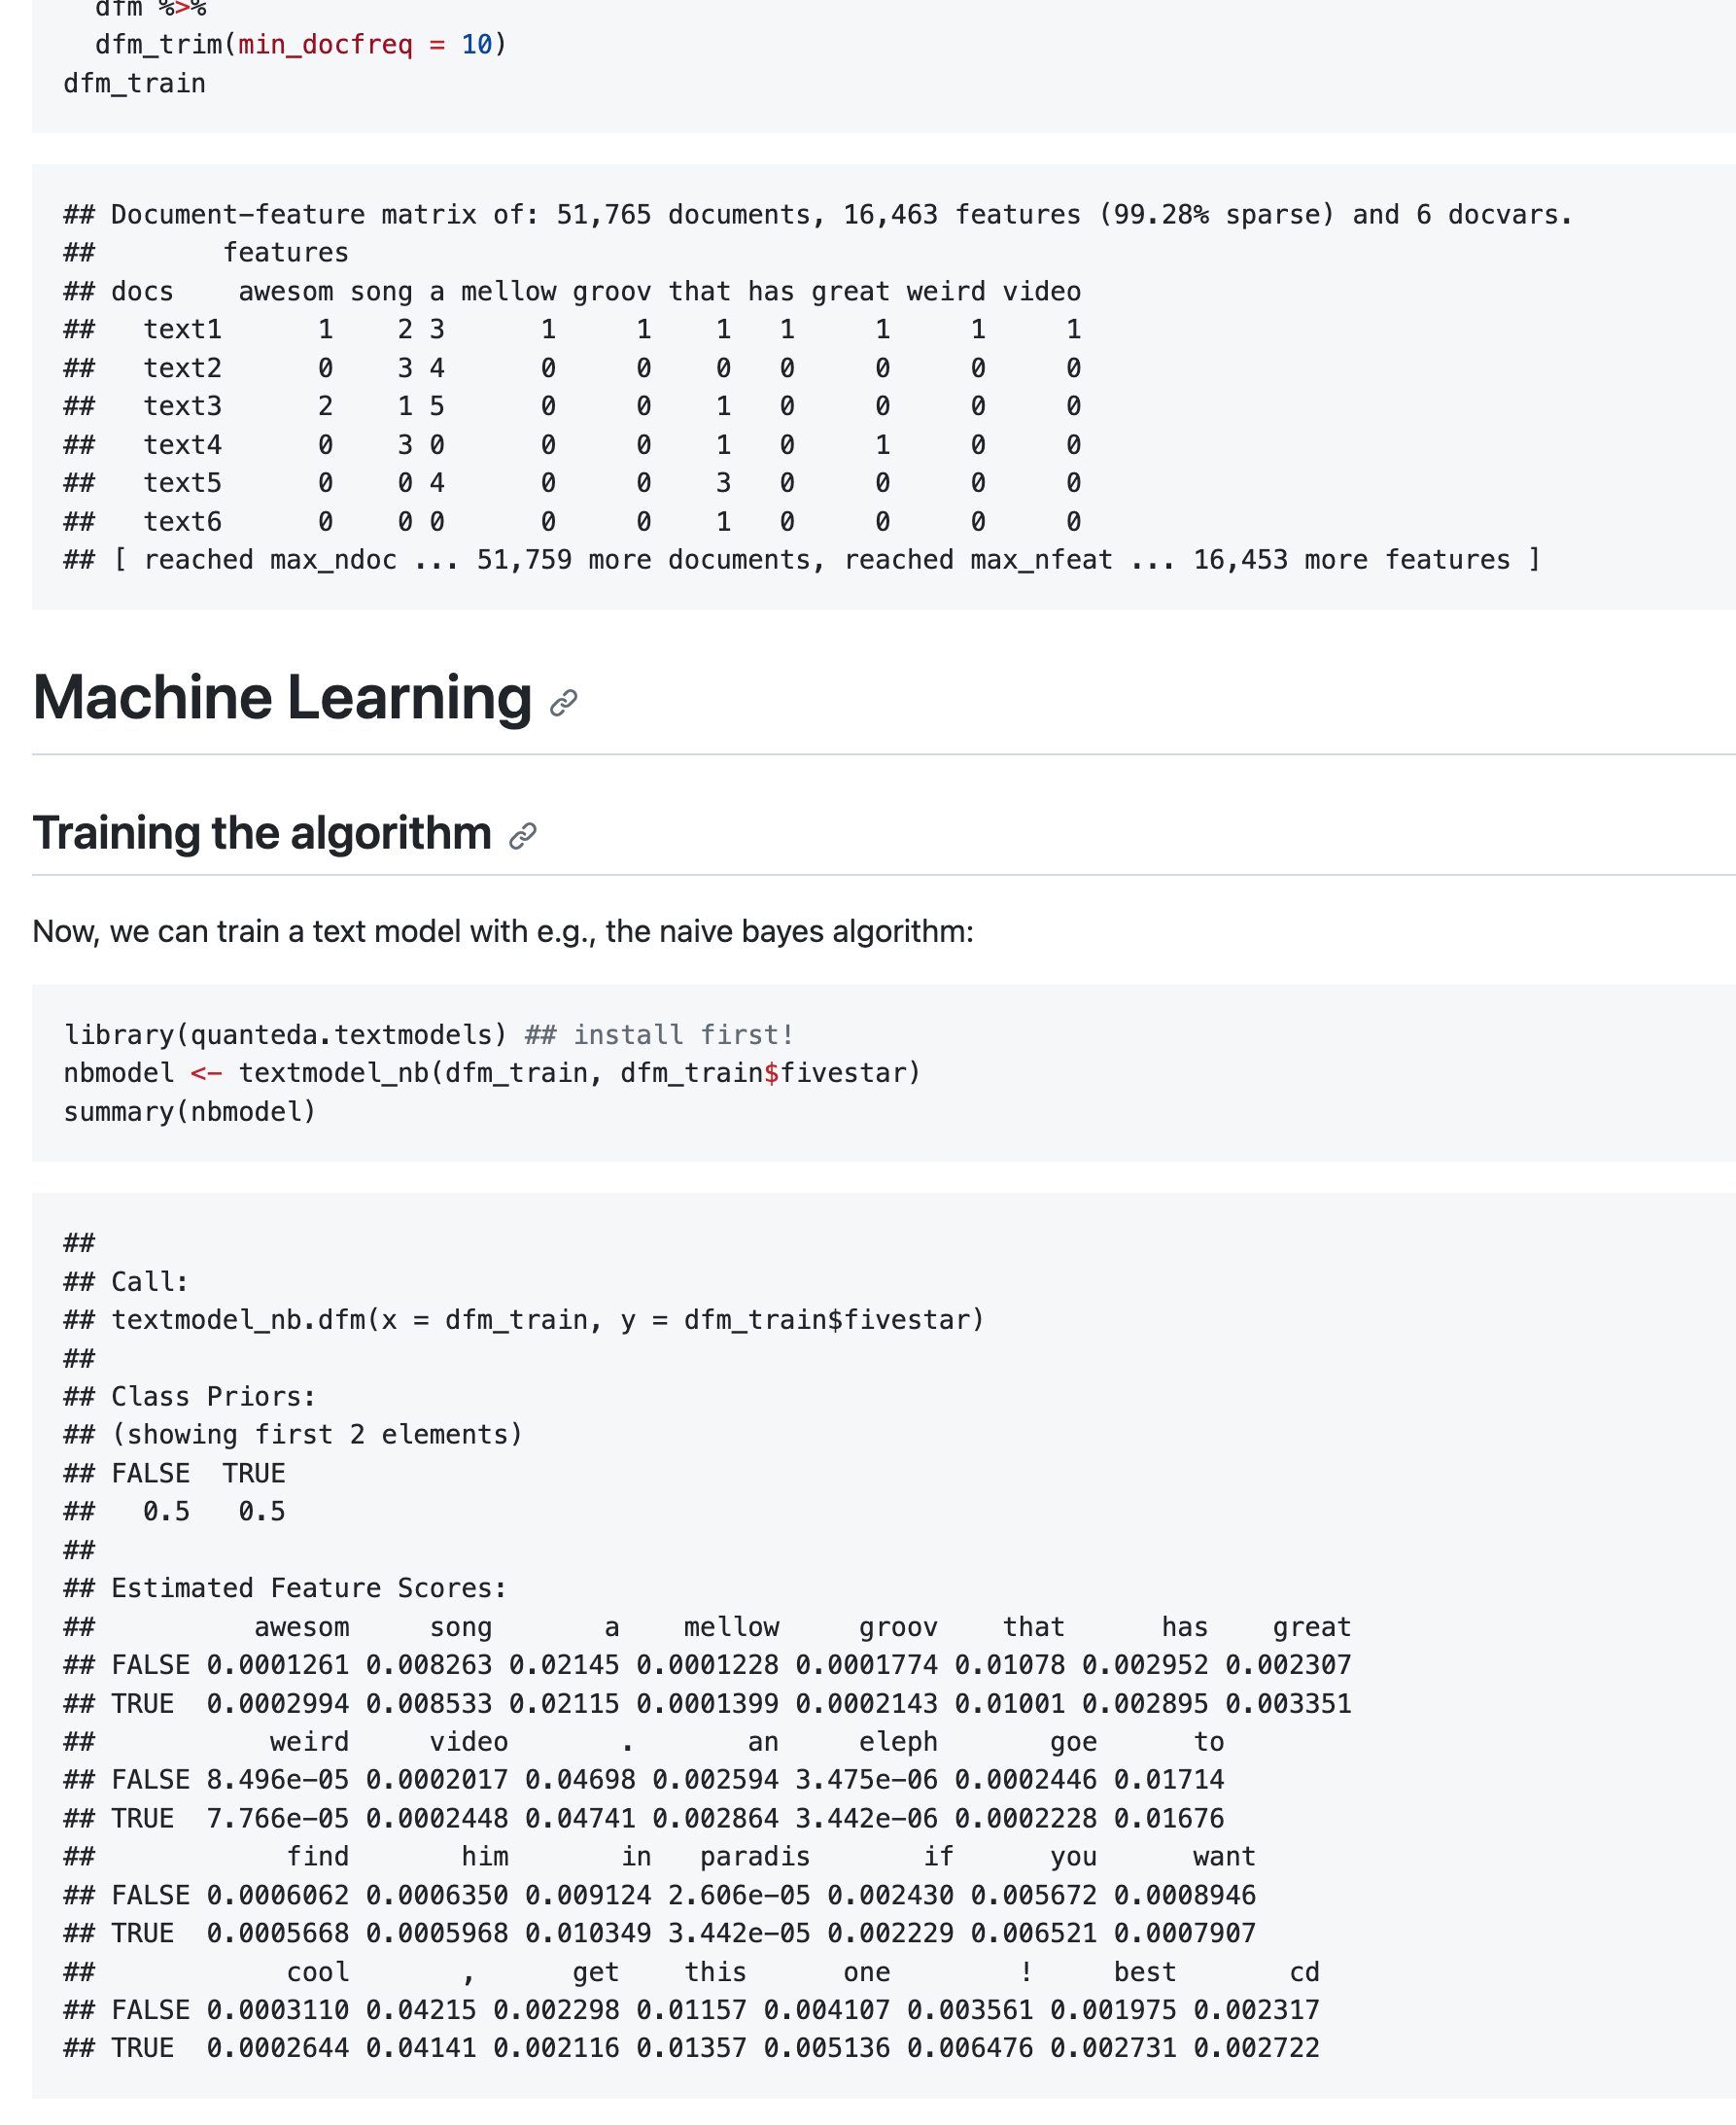
(3) Text classification
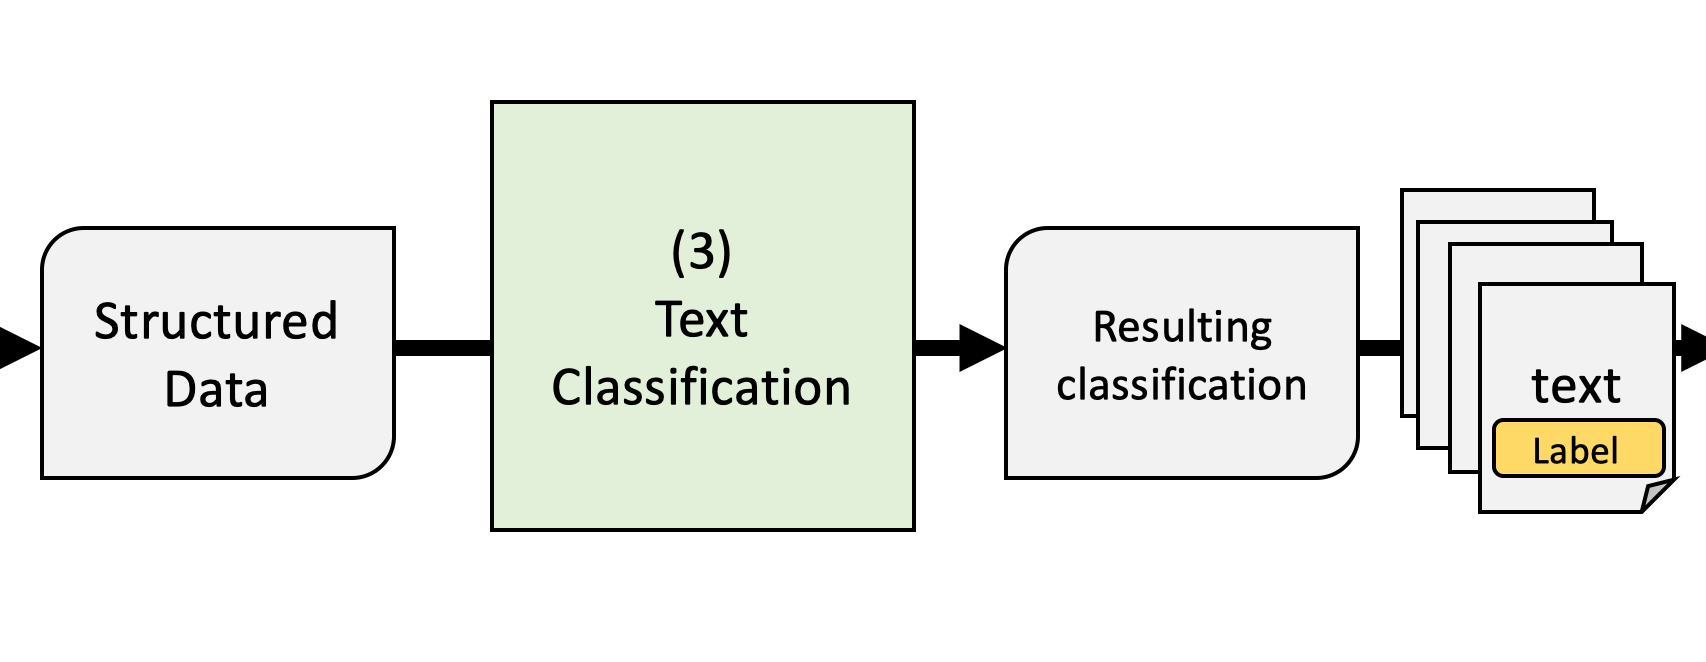
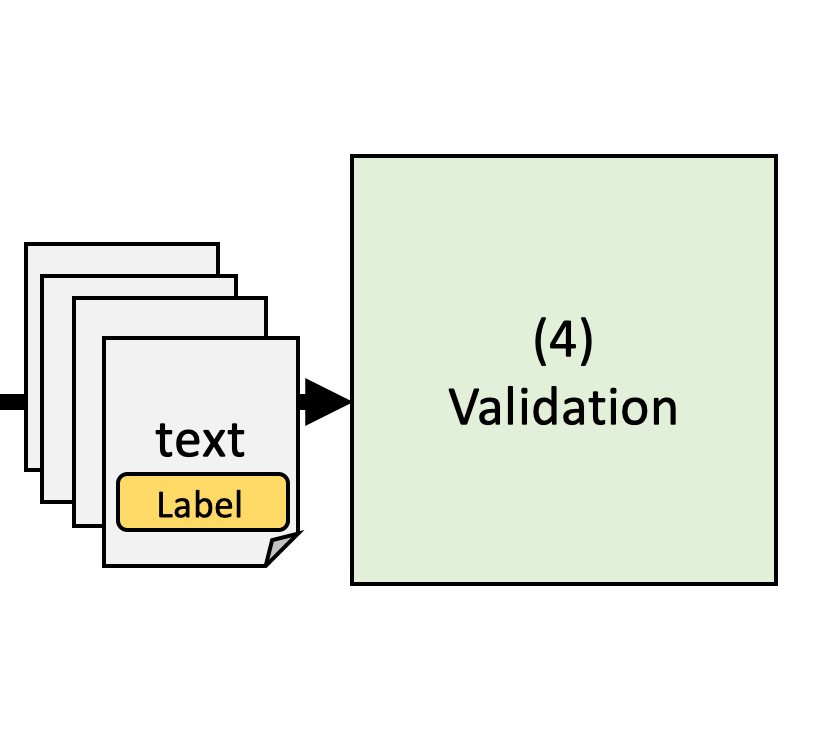
(4) Validation
Many text analysis processes are ‘black boxes’
- even manual coding
- dictionaries are ultimately opaque
- complex algorithms cannot be deciphered
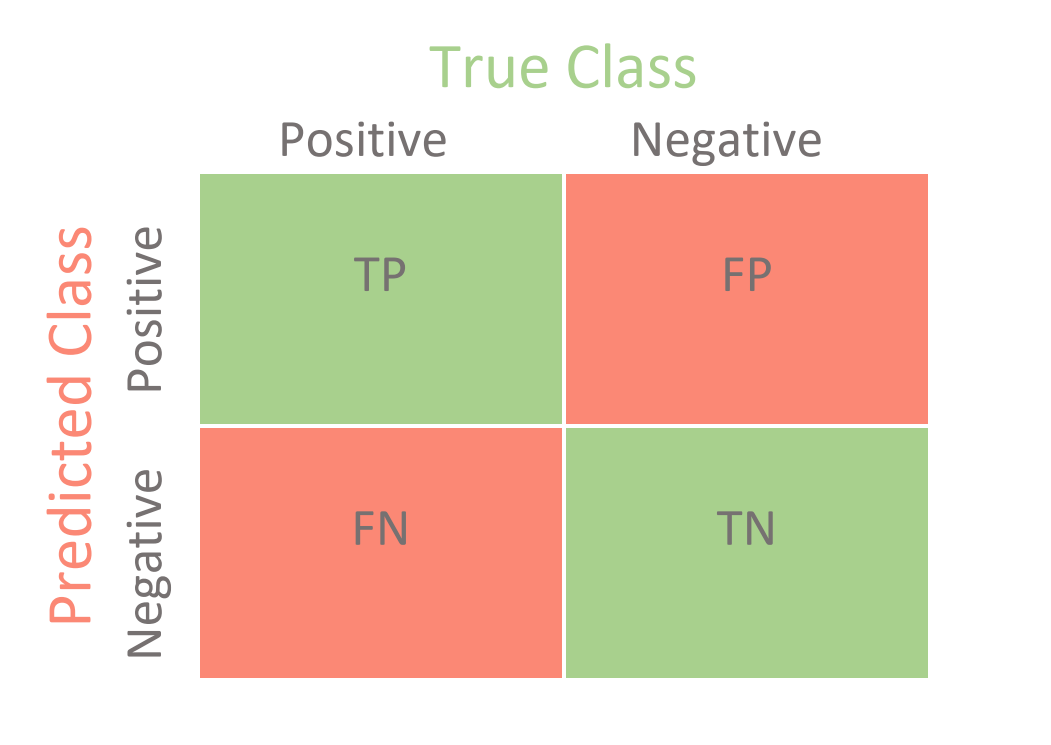
Computer does not ‘understand’ natural language
- It just predicts labels based on features
- False-positive and false-negatives occur
We need to prove that the analysis is valid
- Validate by comparing text analyis output to a known good
- Reference: often manual annotation of a ‘gold standard’
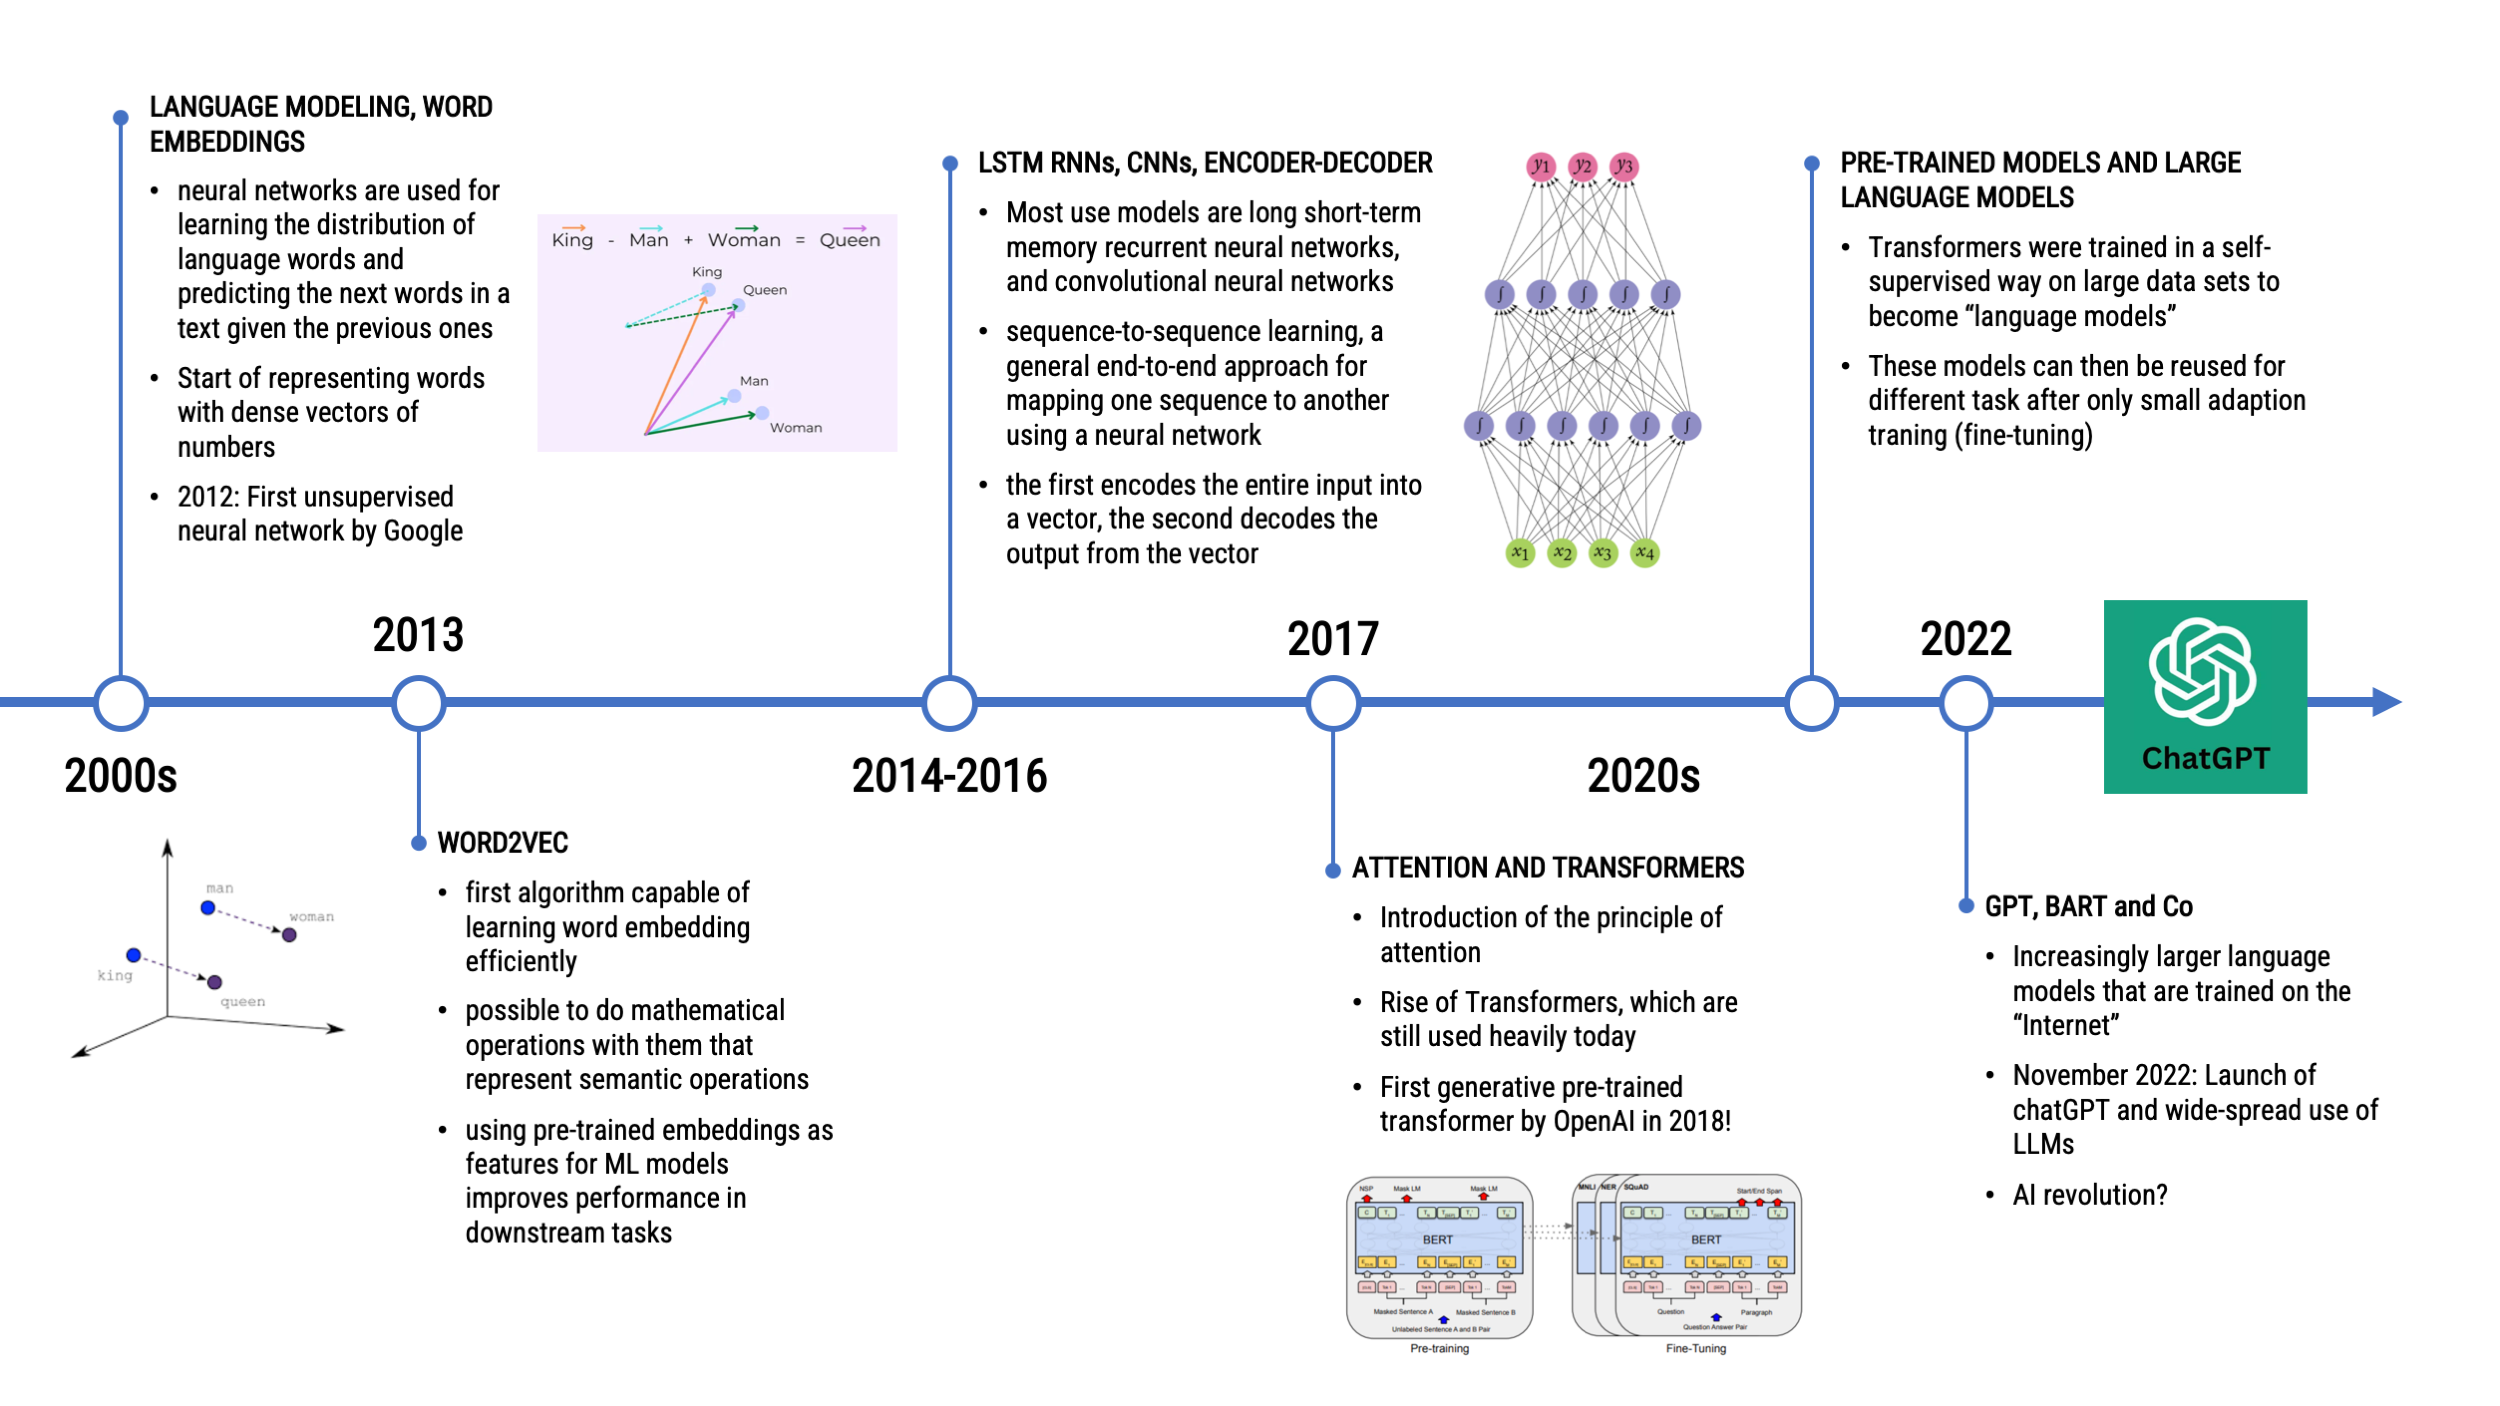
TIMELINE OF NATURAL LANGUAGE PROCESSING
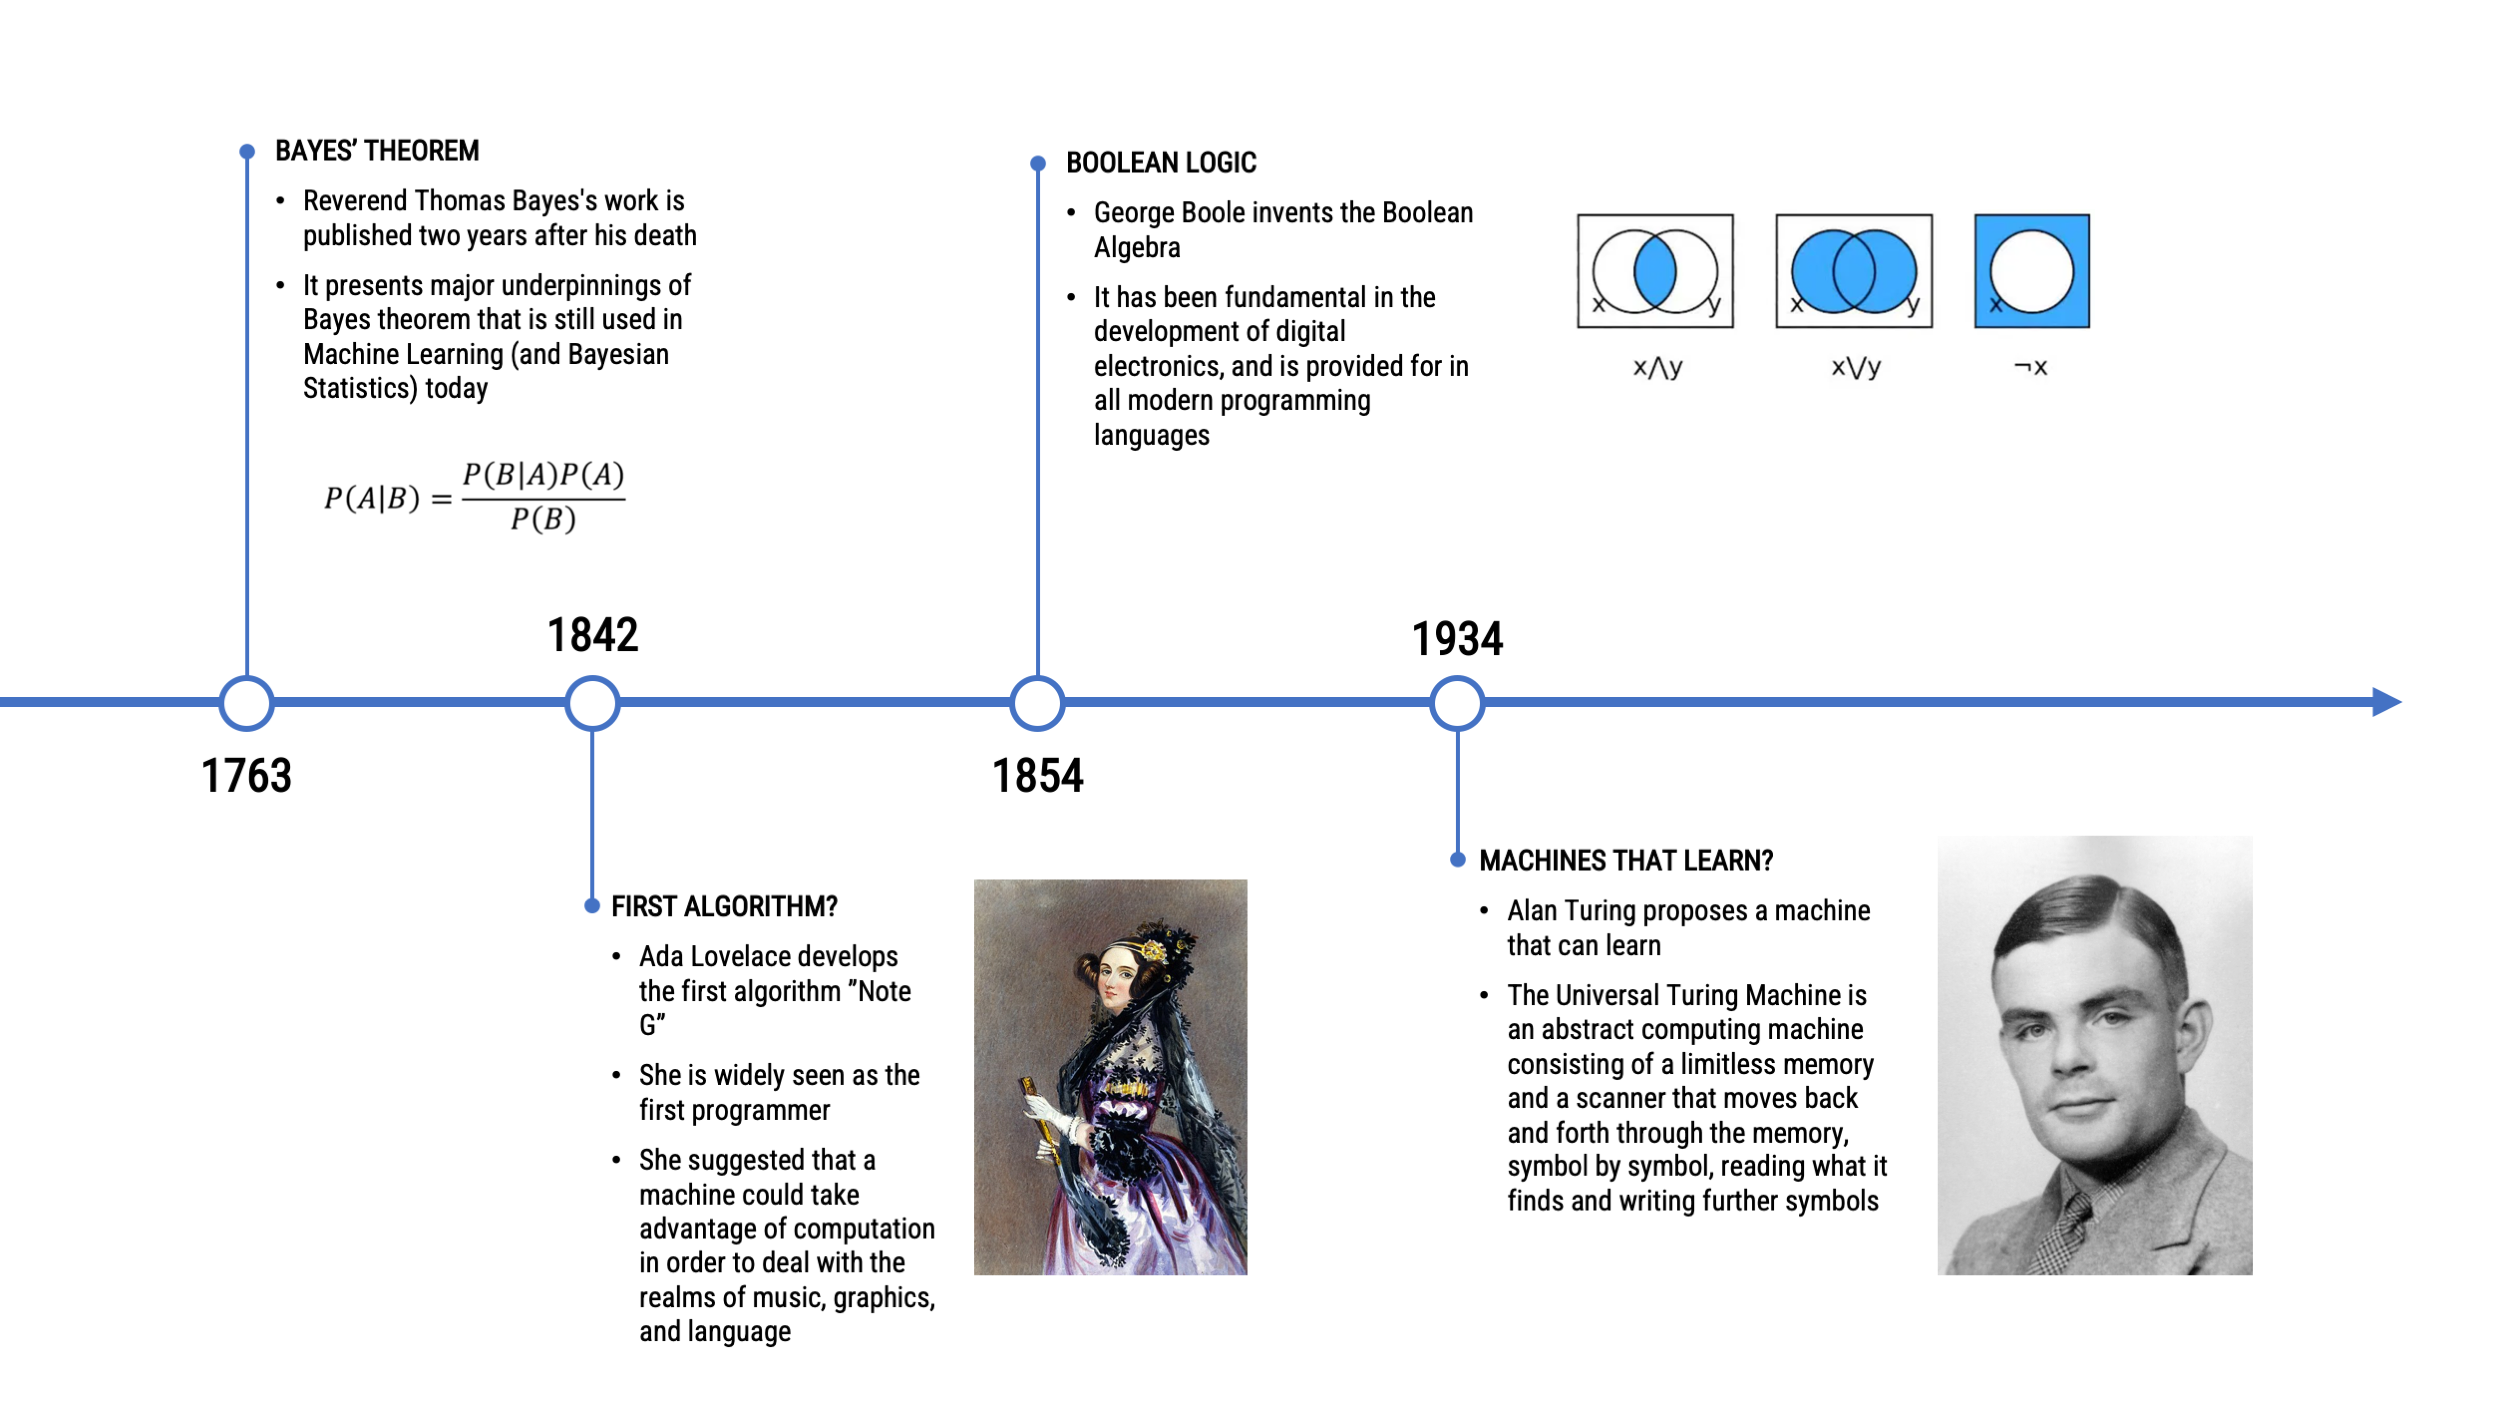
TIMELINE OF NATURAL LANGUAGE PROCESSING
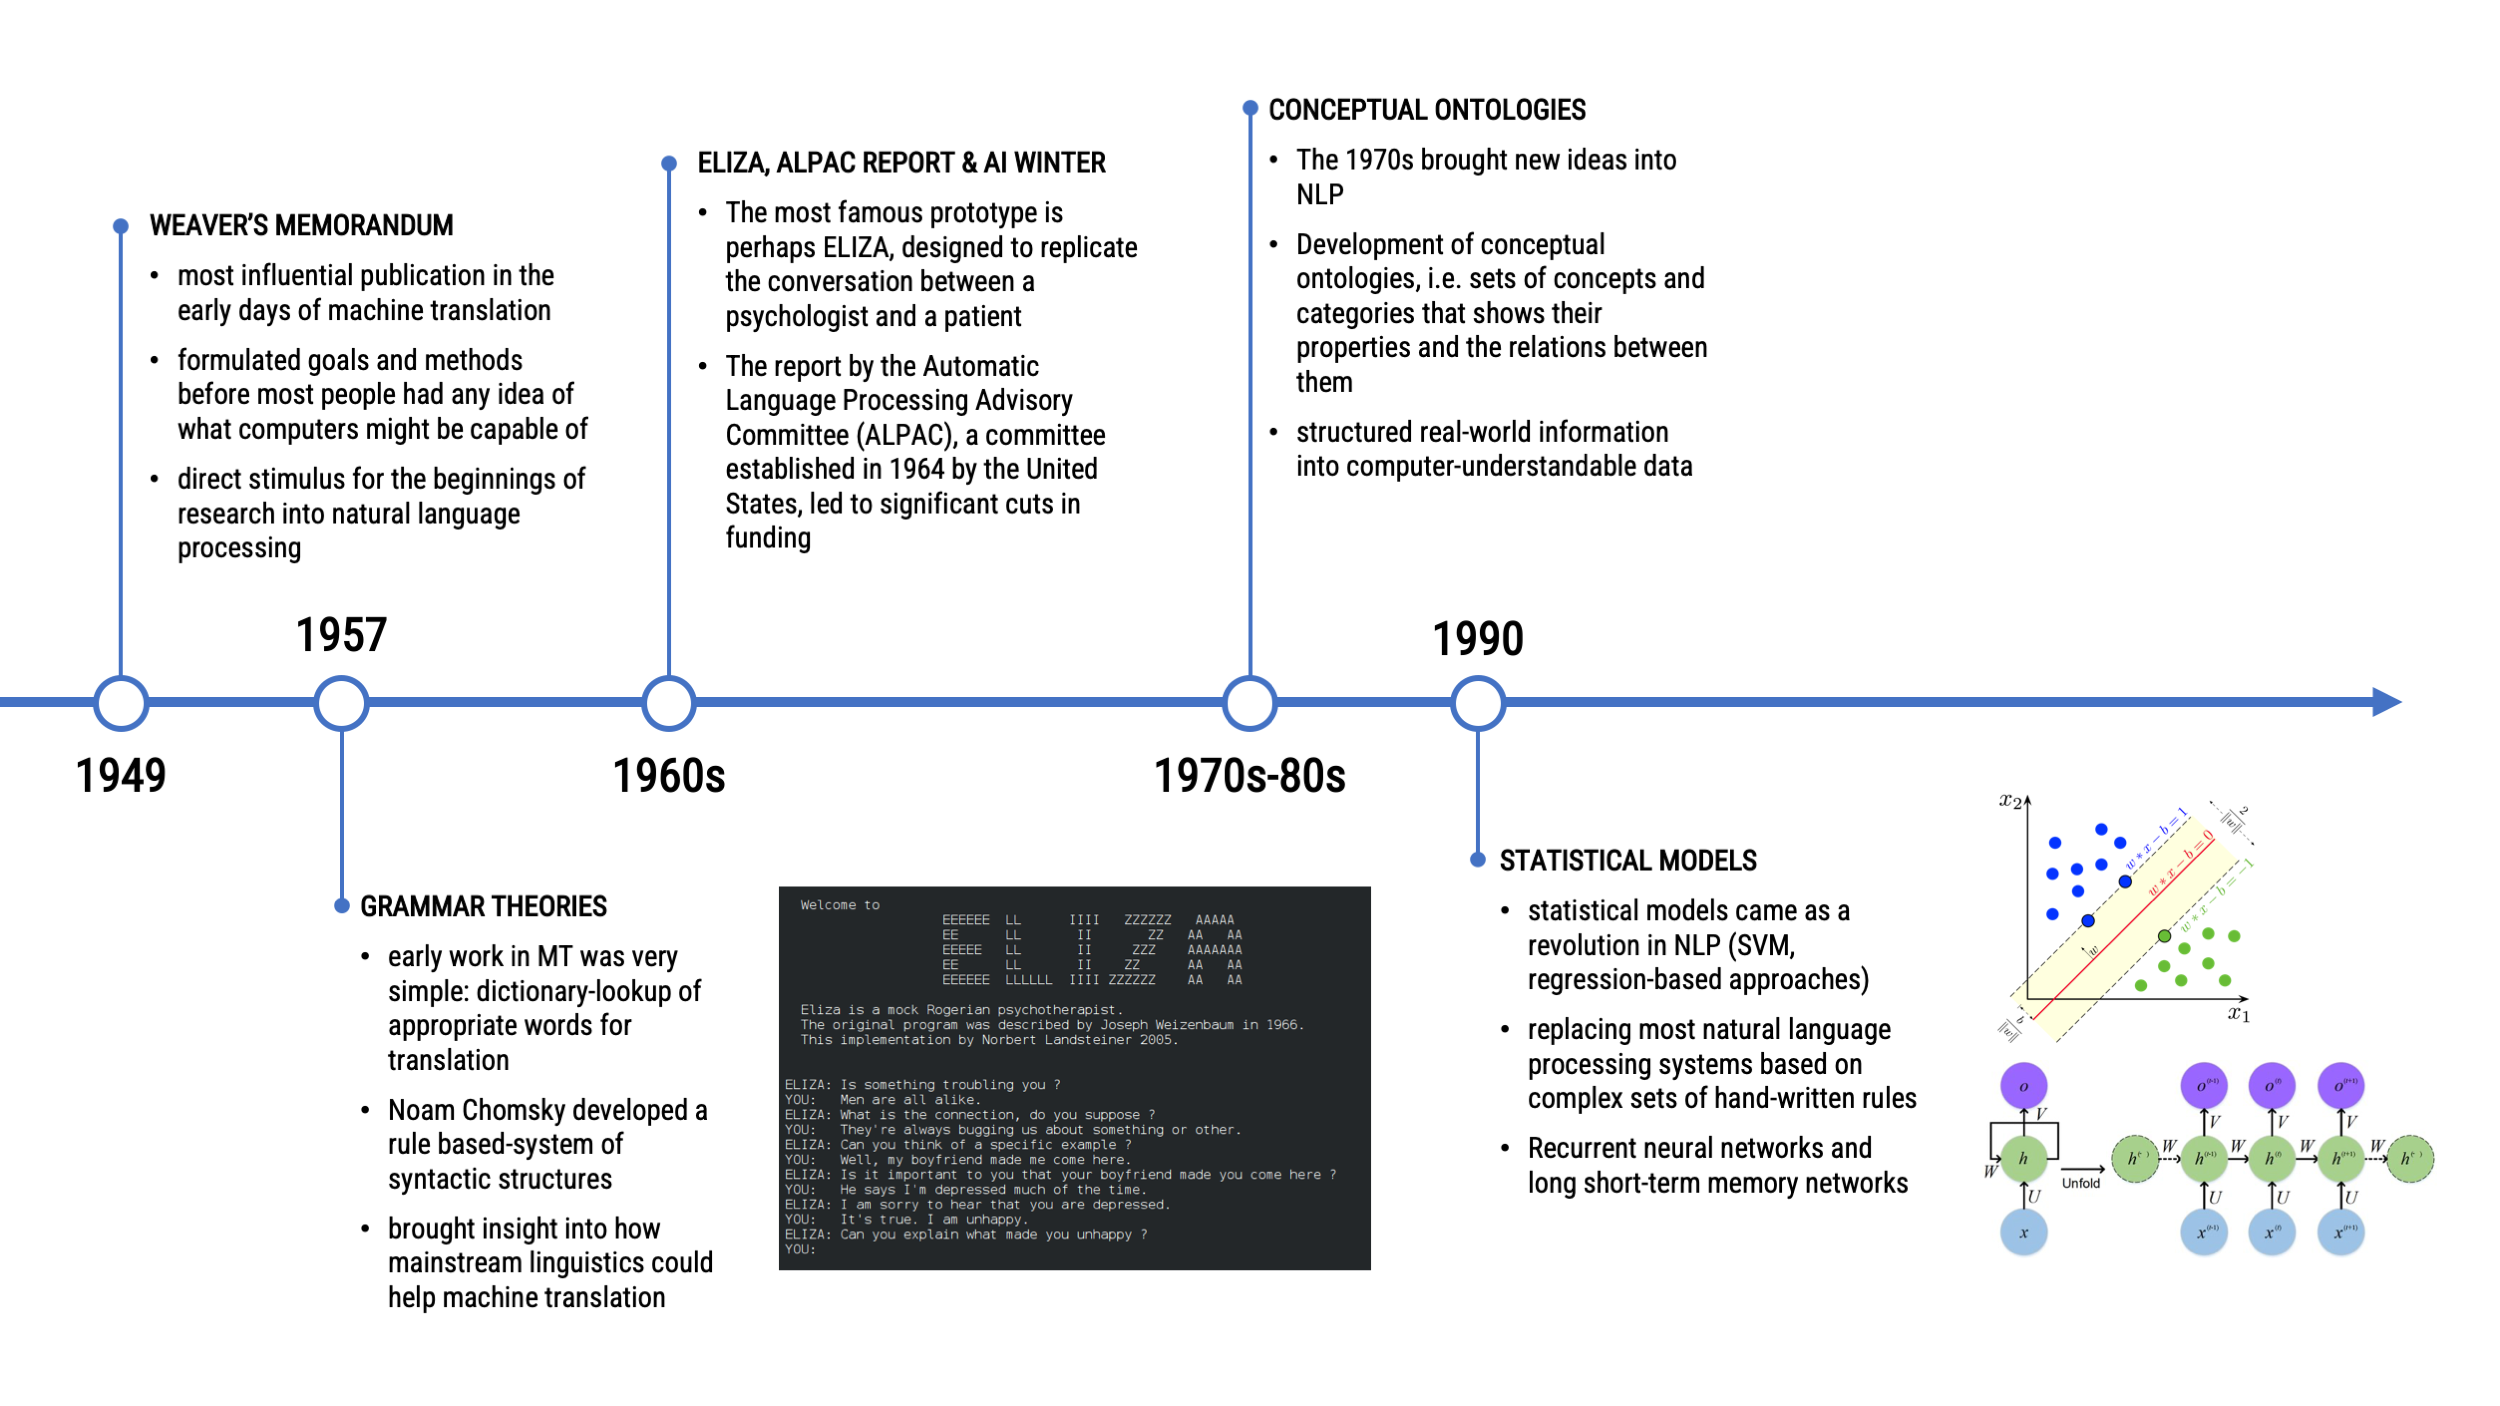
TIMELINE OF NATURAL LANGUAGE PROCESSING
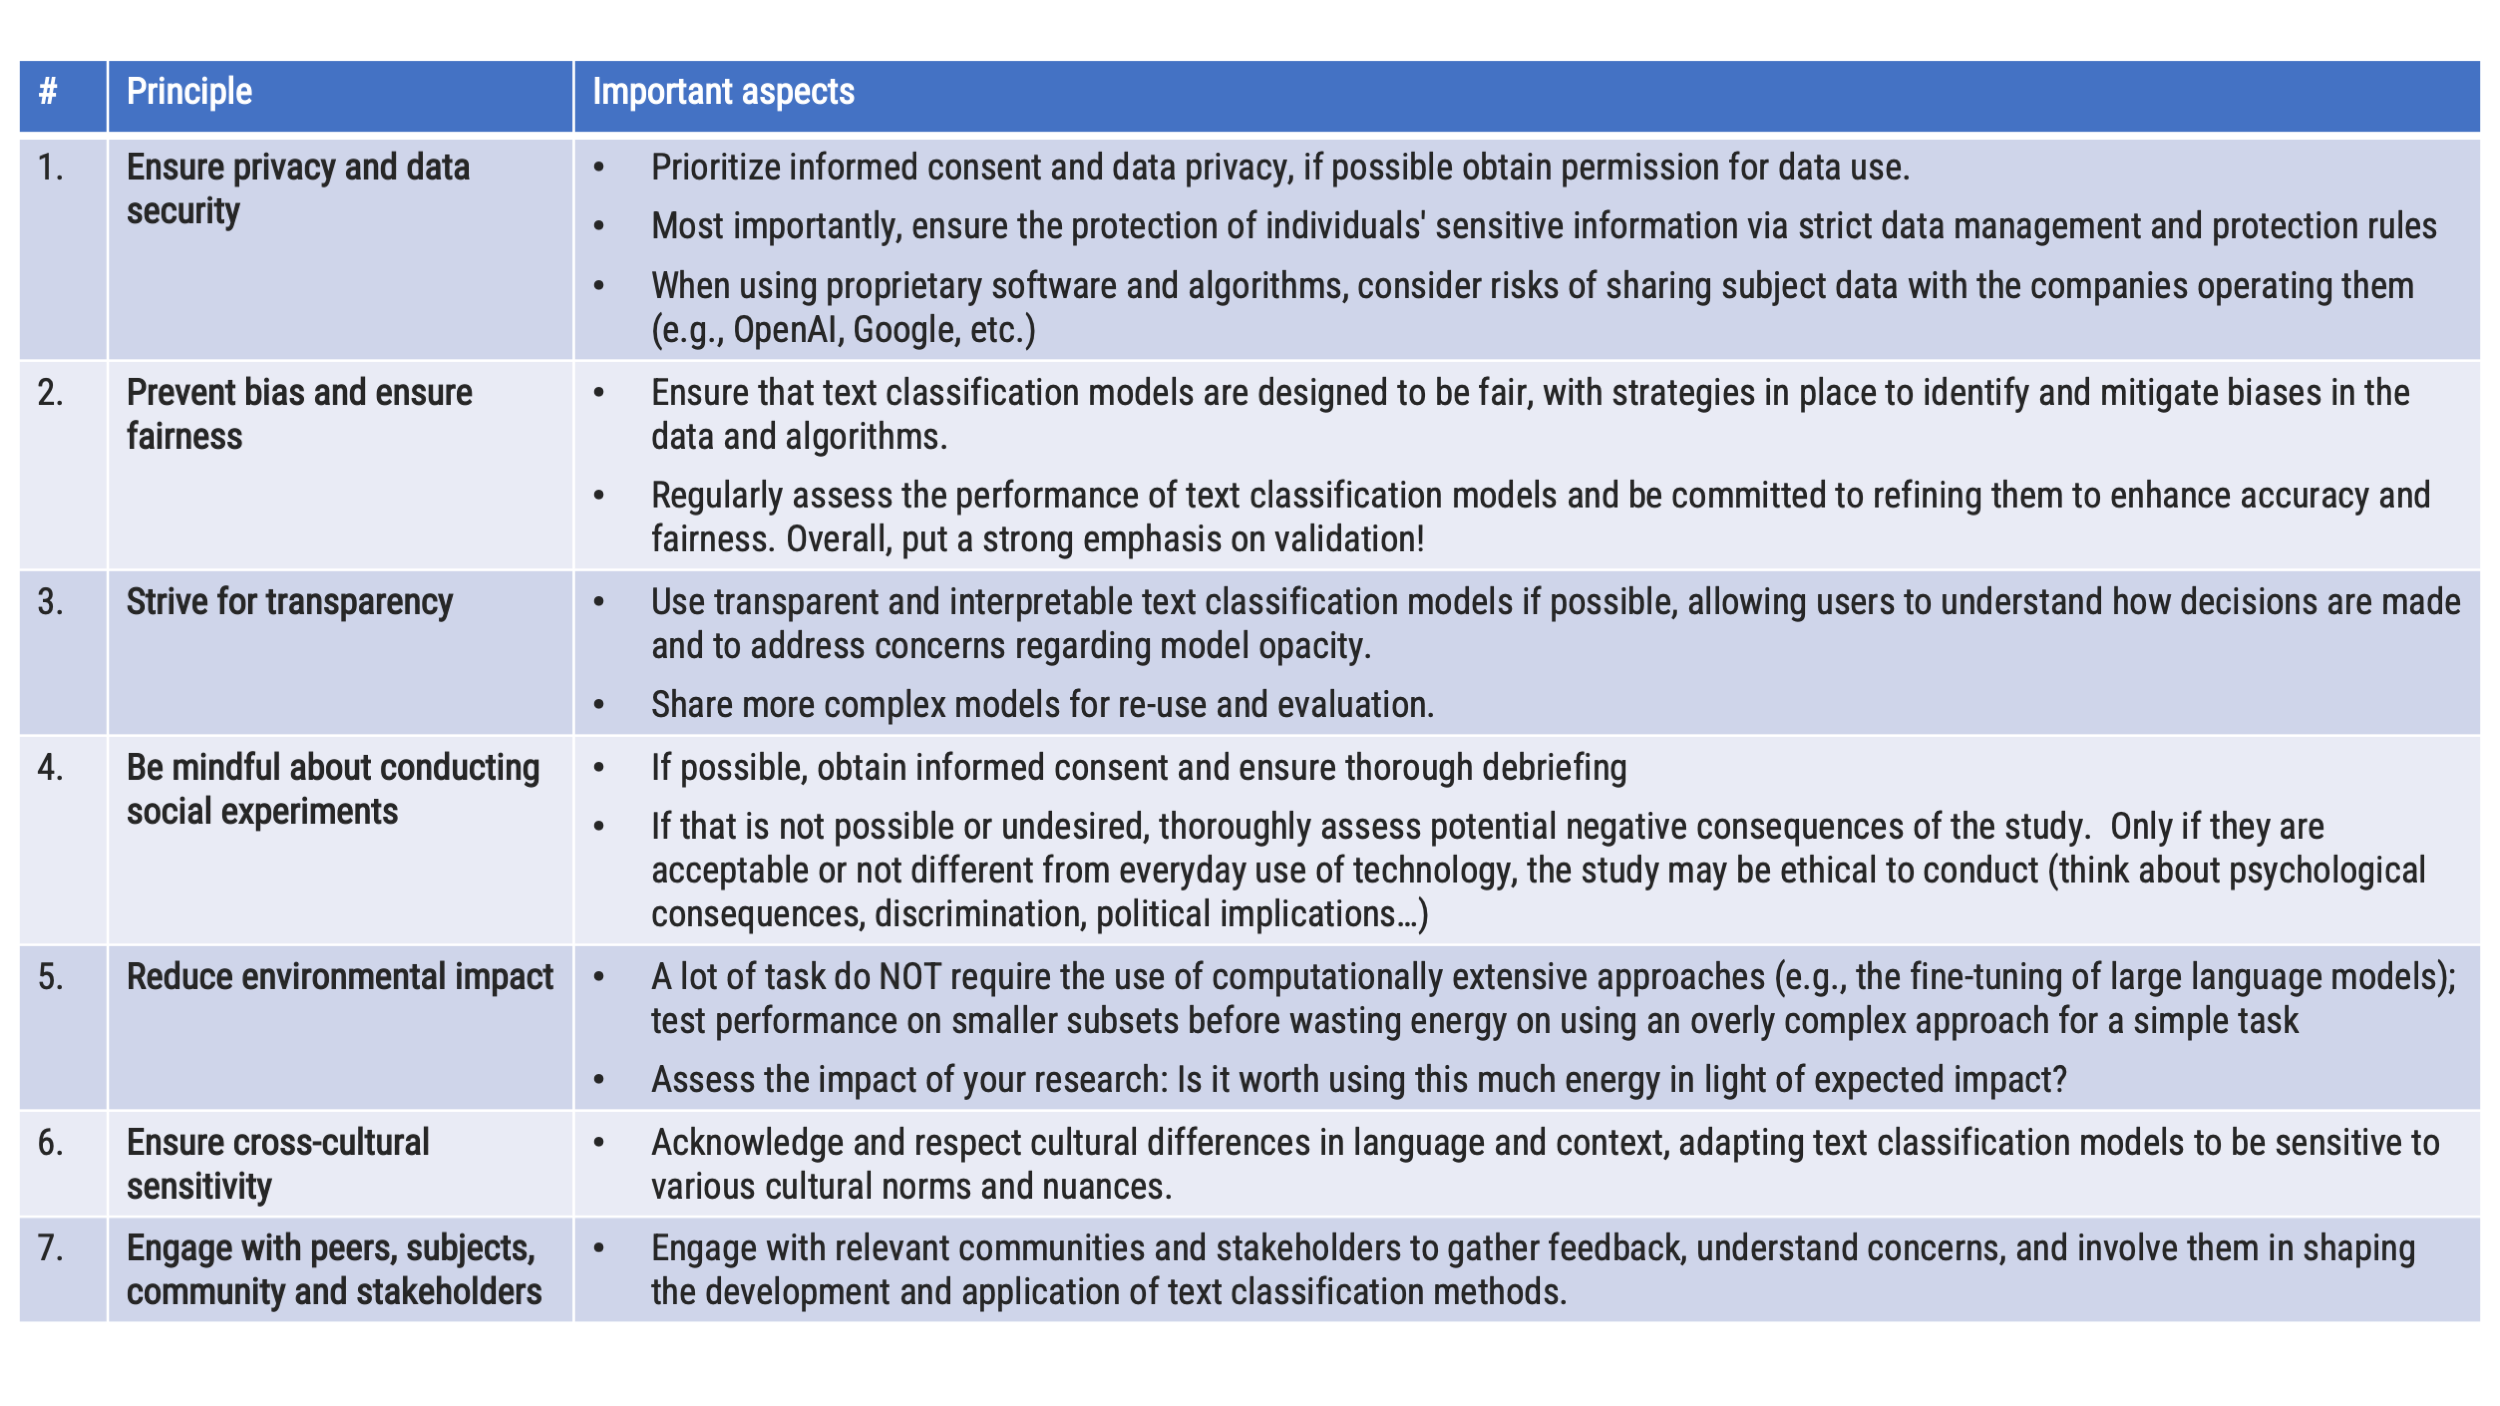
Ethical principles for CCR
Teachers
| Dr. Philipp K. Masur | Dr. Kaspar Welbers | Emma Diel |
Roan Buma |
|||
|---|---|---|---|---|---|---|
 |
 |
 |
 |
|||
| Lecturer & Course Coordinator | Teacher | Teacher | Teacher |
Information and Materials
The major hub for this course is the following website:
Communication and assignment submission via Canvas:
- S_CADC: Computationele analyse van digitale communicatie
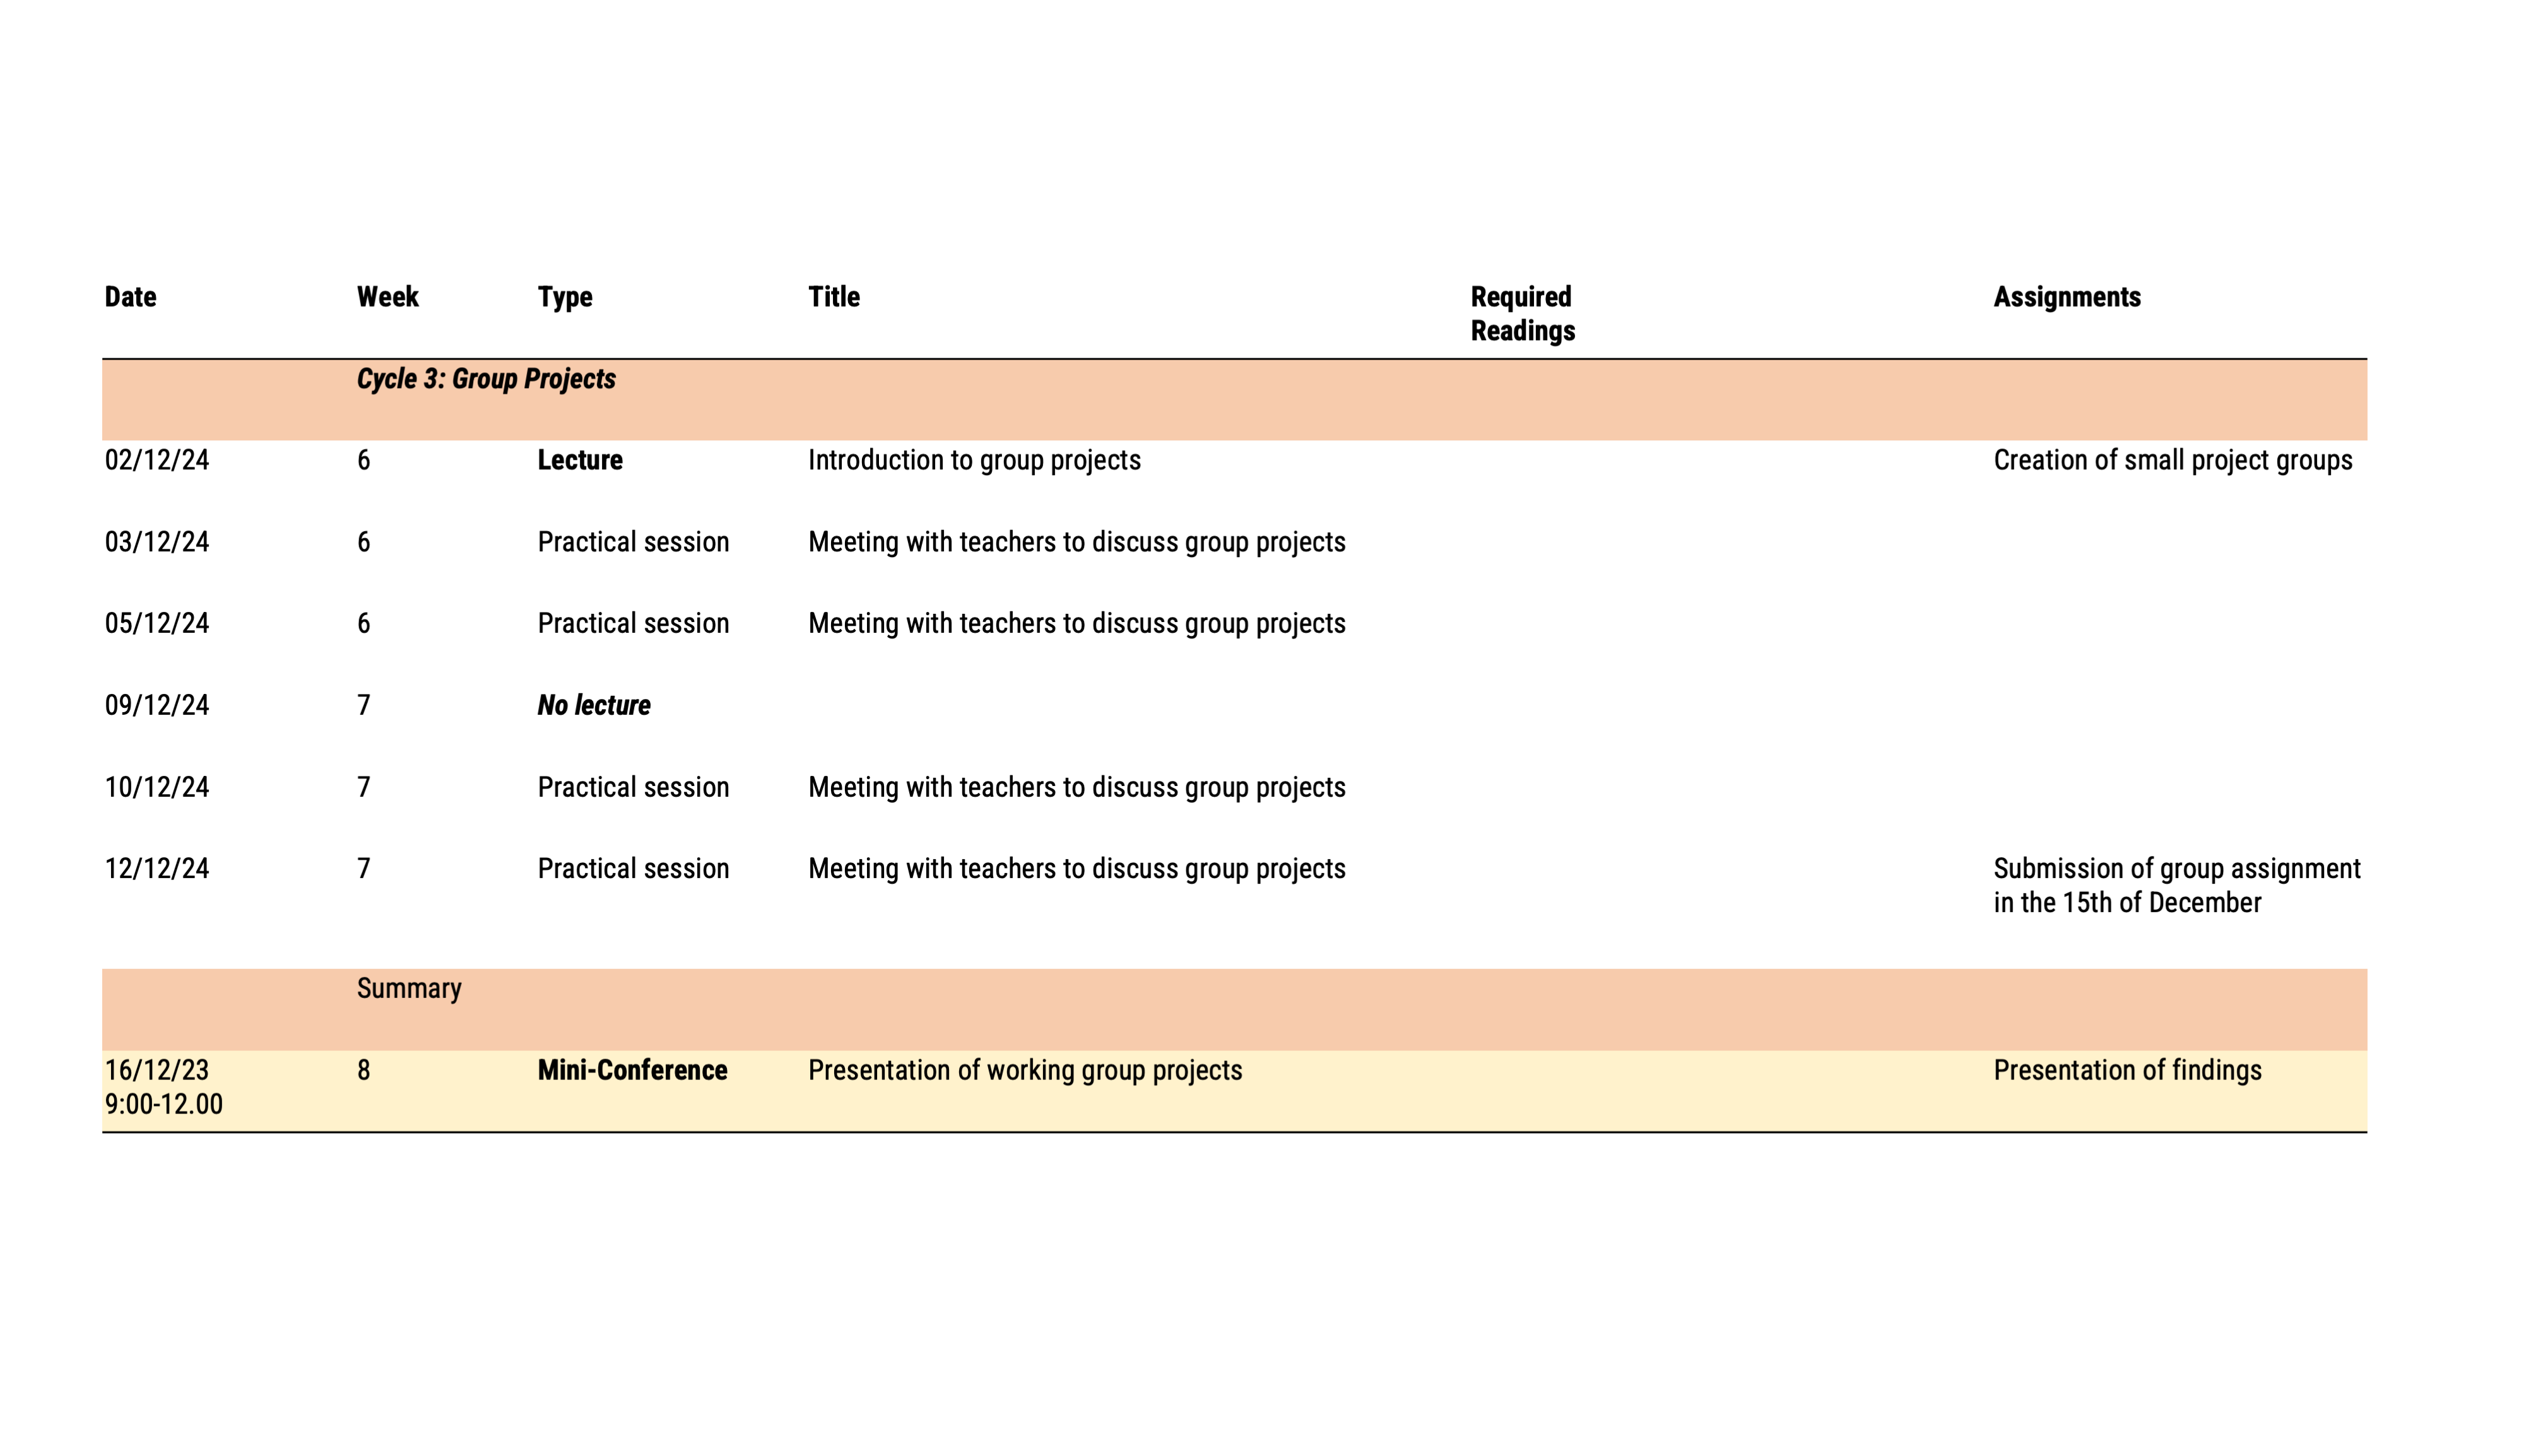
Course Schedule
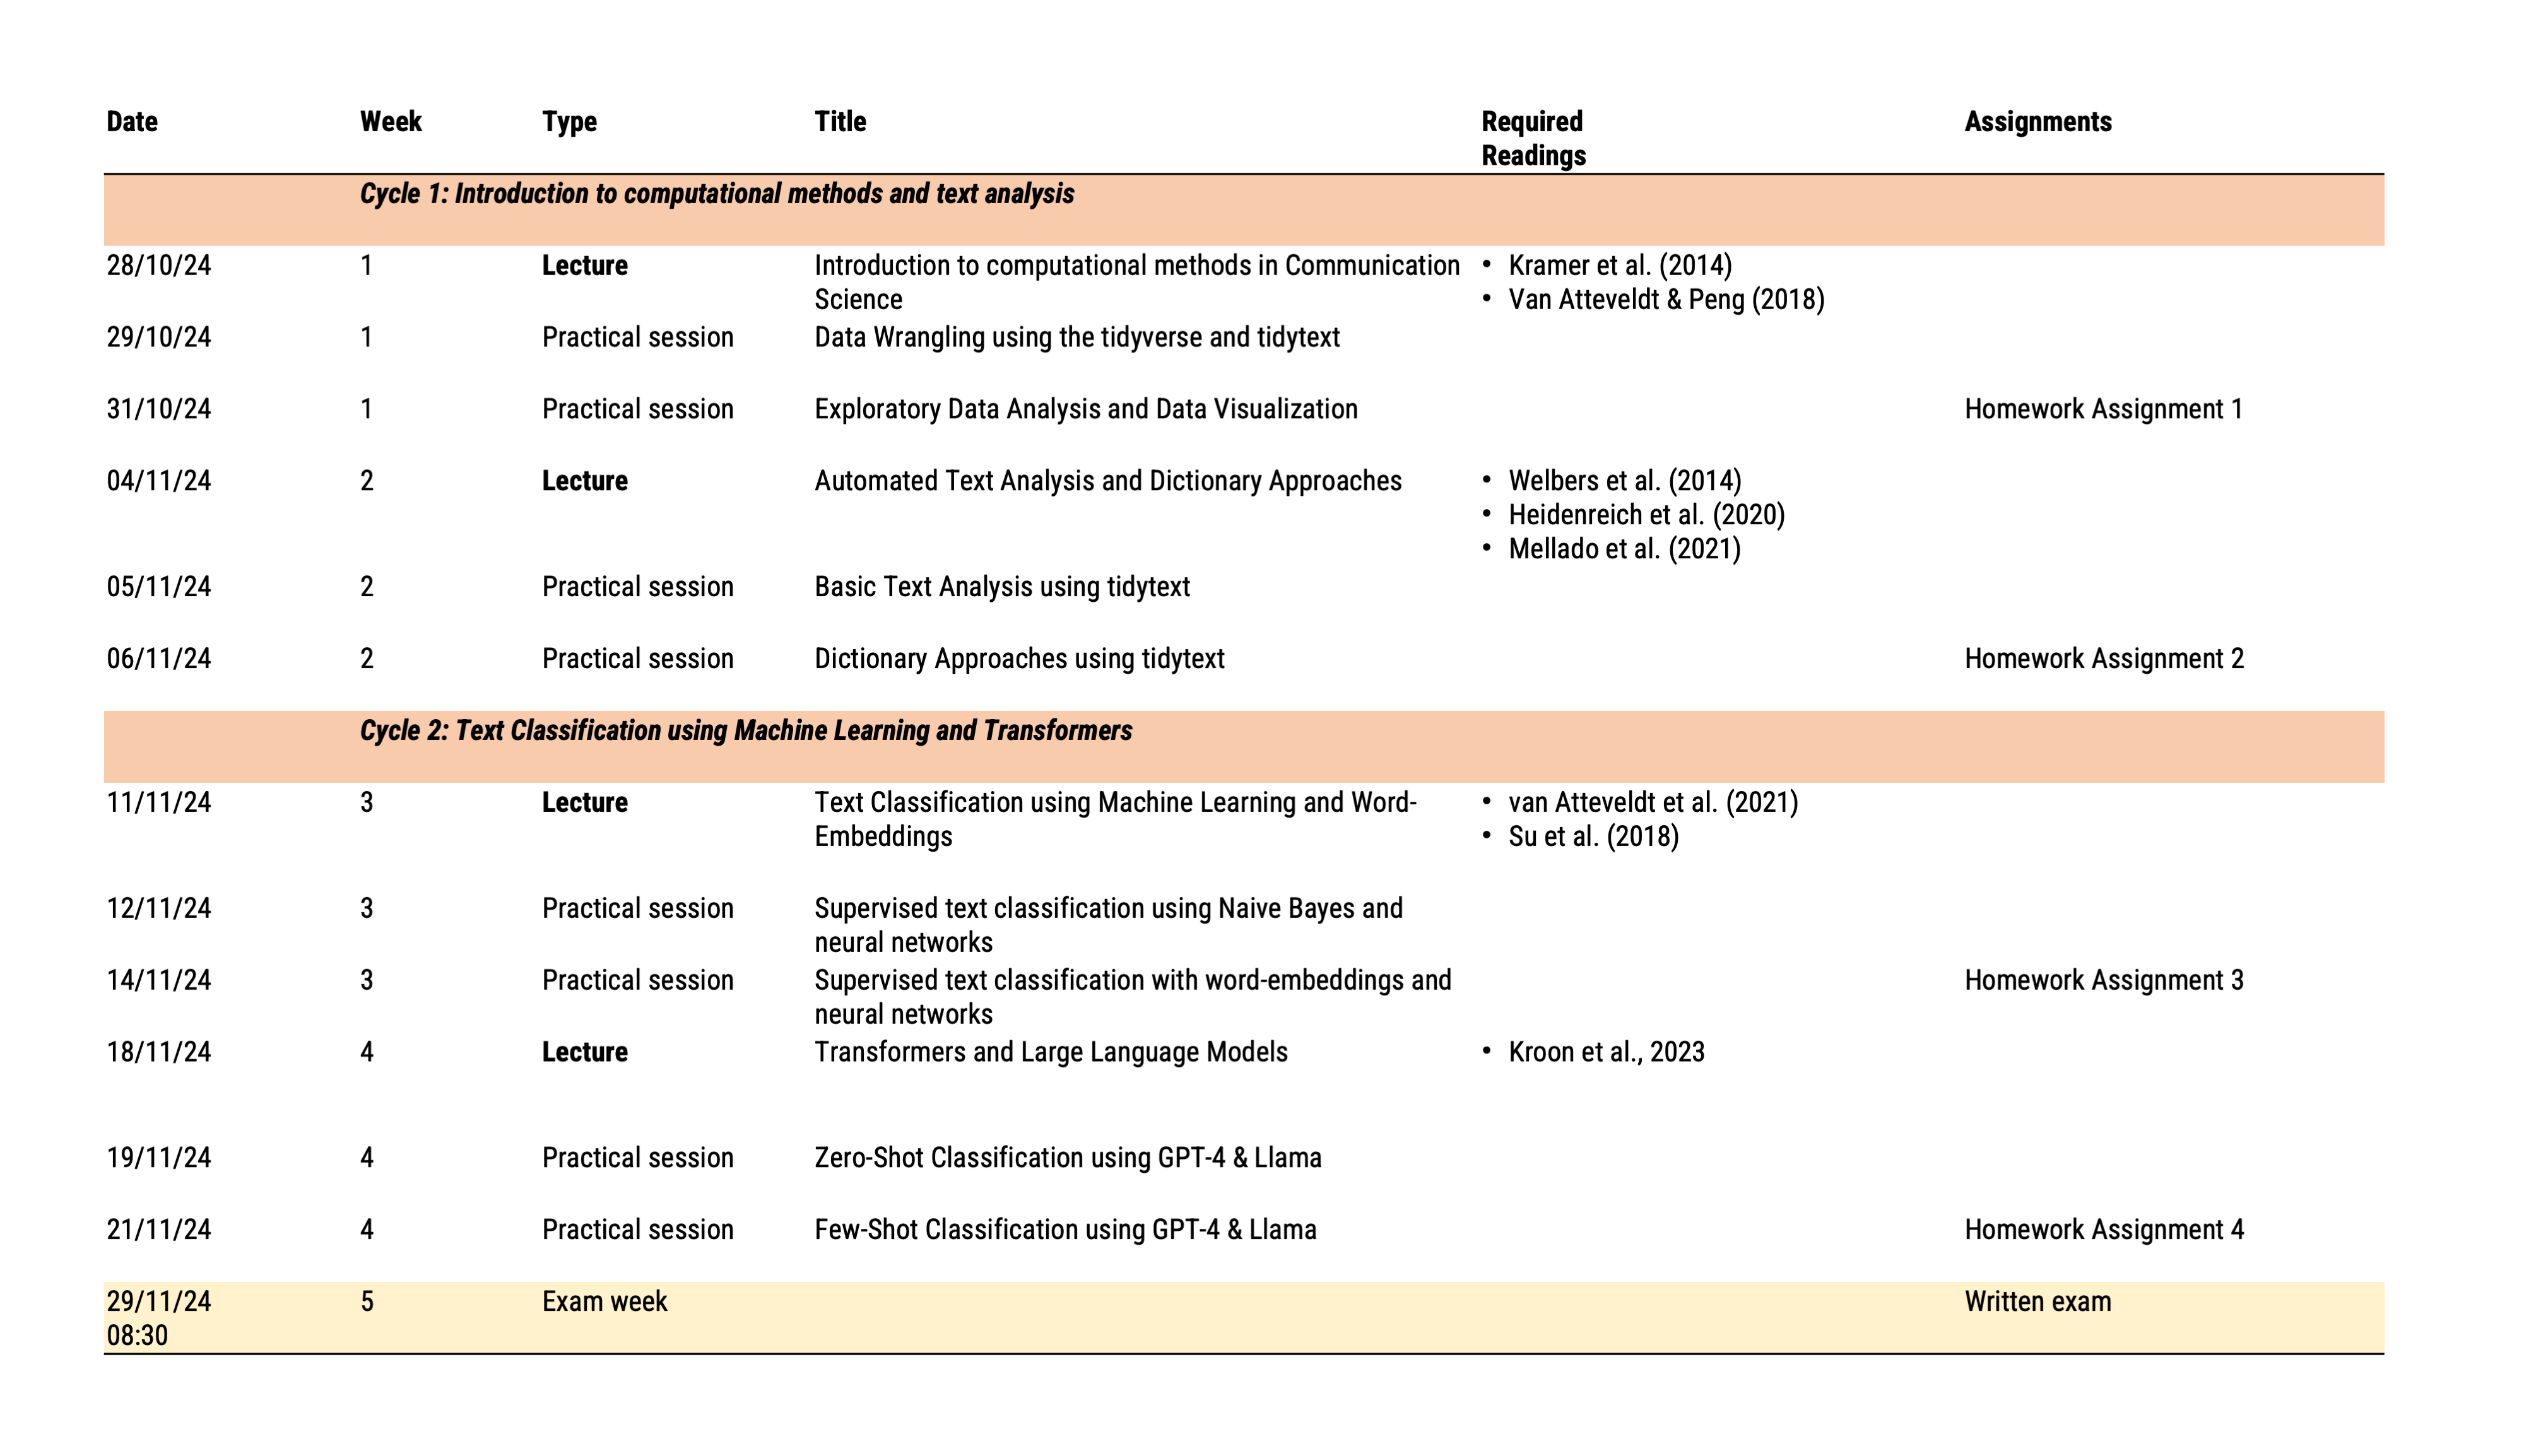
Course Schedule
Thank you for your attention!
![]()