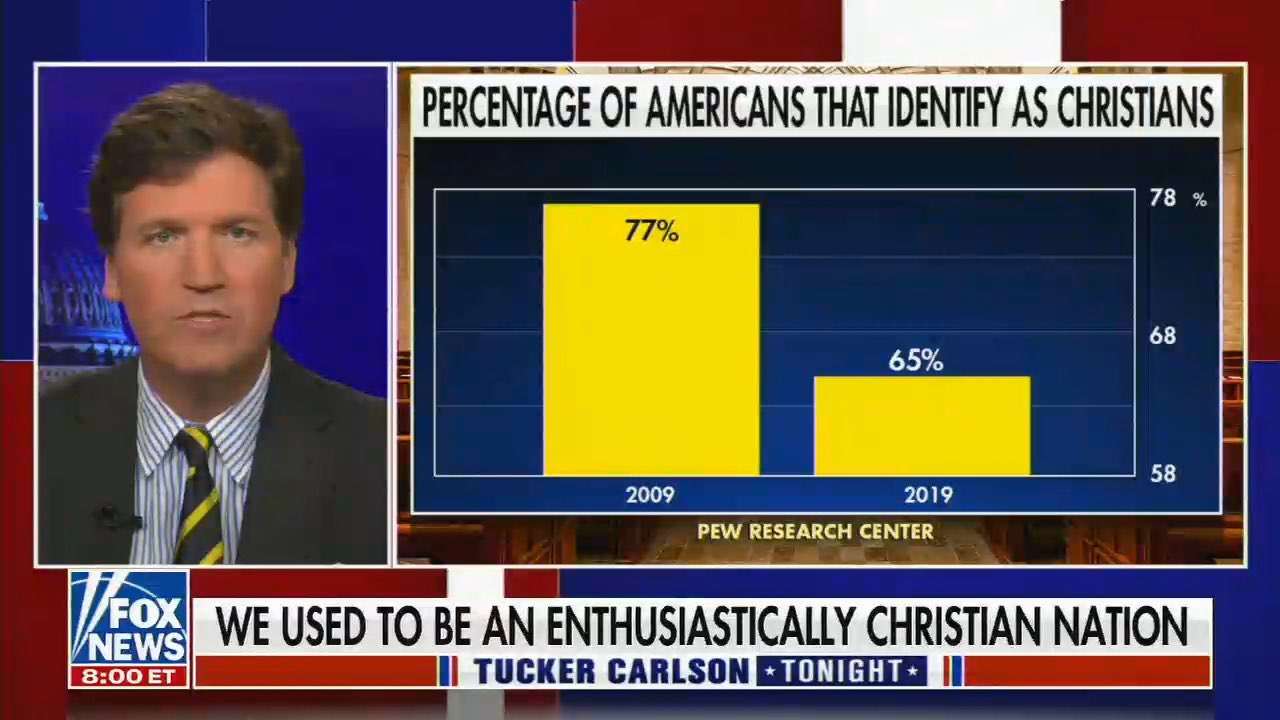
Computational Analysis of Digital Communication

Week 5: Research Projects

Dr. Philipp K. Masur

What was this first part of the course about?

A General Text Classification Pipeline

Example: Political migration discourse on Facebook

  1. Obtaining Text: Scraping data from Facebook and importing it into R

  2. Feature Engineering: Removing noise, summarizing data to creating a tidy data set, transforming the data into a document-feature matrix

  3. Text classification: Run a sentiment analysis to classify the tweets (using a dictionary approach)

  4. Validation: Assessing the classification result against a gold-standard

  1. Substantive Analysis: Predicting sentiment towards migration with party ideology

  2. Visualize: Plotting the relationship between sentiment and party ideology with ggplot2

  3. Communicate: Creating a table and figure and report results in the paper


Heidenreich et al., 2019

Example: Political migration discourse on Facebook

  • In this case, the text classification via a dictionary approach was just a tool to get the data they needed

  • The substantive analysis then used the labels that were created to assess the relationship between party ideology and sentiment towards migration

Dictionary Approach

Classic Machine Learning

Machine Learning with Word-Embeddings

Large Language Models with fine-tuning

Example: Corruption in Austrian News

  1. Obtaining Text: political news articles from six prominent Austrian news outlets spanning 2012 to 2021 via the API of the Austrian Press Agency

  2. Feature Engineering: Used specific search strings previously validated by the Austrian National Election Study to identify relevant articles

  3. Text classification: Used automated content analysis (using BERT) of political news articles from six prominent Austrian news outlets spanning 2012 to 2021 (n = 188,203) to scrutinize political actors’ visibility and favorability in news coverage; fine-tuned on an exisiting data set

  4. Validation: Ran specific experiments to test the validity of the final model (accuracy = .77)

  1. Substantive Analysis: Difference-in-difference estimations to find out whether Kurz (Austrian chancellor at the time) was favored by certain media

  2. Visualize: Plotting differences between time points using coefficient plots with ggplot2

  3. Communicate: Creating report results in the paper


Baluff et al., 2023

Example: Corruption in Austrian News

Large Language Models (zero-shot learning)

P1: Research Methods in Communication Science

  • Bivariate regression: Estimating relationships between two variables

  • Multiple linear regression: Predicting a dependent variable with multiple independent variables

    • With numeric variables
    • With categorical variables
    • Testing assumptions
  • Mediation analysis: Understanding how something may indirectly affect/relate to something else

  • Moderation analysis: Testing whether a third variable influences a relationships or effect

  • Analysis of Variance: Differences in variables

    • Repeated Measurement ANOVAS
    • Mixed Design ANOVAS
    • MANOVAS

Example: Regression in R…

library(tidyverse)
d <- mtcars %>% select(mpg, hp, wt)
m <- lm(mpg ~ hp, d)
summary(m)

Call:
lm(formula = mpg ~ hp, data = d)

Residuals:
    Min      1Q  Median      3Q     Max 
-5.7121 -2.1122 -0.8854  1.5819  8.2360 

Coefficients:
            Estimate Std. Error t value Pr(>|t|)    
(Intercept) 30.09886    1.63392  18.421  < 2e-16 ***
hp          -0.06823    0.01012  -6.742 1.79e-07 ***
---
Signif. codes:  0 '***' 0.001 '**' 0.01 '*' 0.05 '.' 0.1 ' ' 1

Residual standard error: 3.863 on 30 degrees of freedom
Multiple R-squared:  0.6024,    Adjusted R-squared:  0.5892 
F-statistic: 45.46 on 1 and 30 DF,  p-value: 1.788e-07

…and visualized

d$predicted <- predict(m)   
d$residuals <- residuals(m)

ggplot(d, aes(x = hp, y = mpg)) +
  geom_point() +
  geom_smooth(method = "lm") +
  theme_classic()

…and visualized

d$predicted <- predict(m)   
d$residuals <- residuals(m)

ggplot(d, aes(x = hp, y = mpg)) +
  geom_point() +
  geom_smooth(method = "lm", se = F) +
  geom_segment(aes(xend = hp, yend = predicted), alpha = .2) +
  theme_classic()

P2: Comp. Analysis of Digital Communication

  • Data Wrangling: Transforming and reshaping data to suit specific needs

    • Importing data in various formats (e.g., csv, json, text,…)
    • Transforming and summarizing data
    • Reshaping and joining data frames
  • Data Visualization: Creating insights with graphs and figures

    • Creating plots with ggplot2
  • Basics of Text Analysis: Extracting meaning from text / text as data

    • Text Preprocessing
    • Word frequencies and word clouds
    • Keyword searches
  • Automatic Text Analysis: Classifying big corpora

    • Dictionary Approaches
    • Supervised text classification
    • Word embeddings and Zero-Shot Classification With Large Language Models

In R…

library(tidytext)
url <- 'https://bit.ly/2QoqUQS'
corp <- read_csv(url) |> 
  unnest_tokens(output = word, input = text) |> 
  anti_join(stop_words) |> 
  group_by(paragraph, word) |> 
  summarize(n = n()) |> 
  filter(n() > 100) |> 
  cast_dfm(document = paragraph, term = word, value = n)
corp
Document-feature matrix of: 436 documents, 28,071 features (96.80% sparse) and 0 docvars.
    features
docs 04 05 10 100th 11 11th 12 1787 1979 1980
   1  1  1  2     2  1    1  1    1    1    1
   2  0  0  0     0  0    0  1    0    0    0
   3  0  0  2     0  0    0  1    0    0    2
   4  0  0  0     0  0    2  0    0    0    0
   5  0  0  2     0  1    0  2    0    0    0
   6  0  0  2     0  2    1  1    0    0    0
[ reached max_ndoc ... 430 more documents, reached max_nfeat ... 28,061 more features ]

Visualized

library(quanteda.textplots)
textplot_wordcloud(corp, max_words = 100)

Additional methods

For the purpose of this course, we have created more knowledge clips and tutorials that you can work through by yourself (if necessary for the project at hand). These tutorials cover some things that you already know (but haven’t done in R) as well as some new methods that might be interesting for the research projects:

  • Test theory and factor analyses: Measuring abstract concepts

    • Confirmatory factor analyses
    • Exploratory factor analyses
    • Item Responsy Theory (IRT) Analyses
  • Advanced statistical modeling:

    • General linear model
    • Multilevel Modeling
    • Structural Equation Modeling
  • Web Scraping: Getting data from online sources

    • Using scrapers
    • Using APIs
  • More Text Analysis: Unsupervised Machine Learning

    • e.g., Topic modeling

What happens now?

Research projects

  • We create small working groups (4 students per group)

  • You will conduct your own research projects

    • Getting data
    • Preparing, coding, transforming….
    • Classifying texts
    • Visualizing
    • Testing assumptions/hypotheses
  • Teachers will supervise your progress and support you during the practical sessions times

  • At the end, you will present your findings at a mini-conference (18th of December)

How will the supervision work?

  • Each group will be assigned to a) a teacher (Kasper, Emma or Roan) and b) a particular time slot (during the usual practical session times)

  • You will have 15 minute time slots with your supervisor

  • The first supervision session is not on Tuesday, but on Thursday (so that you can go to the master thesis information session)

  • Yet, until Tuesday night, you will need to send a short proposal for the research project to your teacher.

    • What is the topic?
    • What are your main research questions?
    • What method are you planning to use?
  • In the actual supervision sessions, we expect you to come prepared:

    • Have concrete questions
    • Have the analysis up and running on your computer, so that we can help with problems

Final presentation at the “mini-conference”

  • This mini-conference is going to be a so-called “poster-market”

  • You will create an academic poster (DIN A0) that we will put on the wall

  • During the conference, everybody (including some colleagues) will be able to check out everybody’s project and discuss the results!

  • Time and Date: 18th December from 9:30 to 11:30

    • There will be three parallel sessions, but you can switch between them at all times
    • More information soon (including exact schedule)

Poster sessions

Source: ECMWF on Flickr

Example Posters

What is a poster?

Structural Elements:

  • Title:

    • Clearly state the main idea of your research.
    • List the names of all contributors under the title
  • Introduction:

    • Briefly introduce the background of your resear
    • Clearly outline the goals/hypotheses of your project
  • Methods:

    • Describe your research methods concisely
    • Use visuals like flowcharts or diagrams
  • Results:

    • Display key findings using graphs, charts, and tables.
    • Focus on clarity and avoid overwhelming details.
  • Discussion:

    • Interpret your results and relate them to the research objectives.
    • Discuss implications and potential applications.
  • Reference

Tips and Tricks for Design:

  • Visual Hierarchy:

    • Prioritize information using font size, color, and layout.
    • Guide the viewer’s eye through the content logically.
  • Consistent and Balanced Style:

    • Maintain a consistent font style and color scheme.
    • Choose few, clear, ad readable fonts.
    • Ensure a balanced layout that is not too crowded.
  • Use of Images and Graphics:

    • Include high-quality images, charts, and graphs.
  • Color Scheme:

    • Use a cohesive color scheme.
    • Ensure good contrast between text and background colors.
  • Limited Text:

    • Keep text concise and to the point.
    • Use bullet points and short phrases instead of dense paragraphs.

Two more examples

Deadlines

  • You are required to hand in the RMarkdown, a compiled html output beforehand (Sharp Deadline: 17th of December 2021 at 24:00)!

  • If you want to have your poster printed by us, you need to submit it via mail as PDF to p.k.masur@vu.nl on Thursday, the 14th of December 2023 (at 24.00 latest). We need the Friday to actually print them.

  • You can choose to print it yourself later, but unfortunately, we won’t be able to reimburse you then.


Any questions?

Let’s build groups!

Canvas

  • Please go to Canvas

  • You can assign yourself to a group (max 4 people)

  • In the end, I will put remaining people randomly into the groups with open places

  • Note: Please only build groups with people from groups that have the same time slot (otherwise your supervision will be in at a different time than the practical sessions!)

  • Go!

Inspiration

Where to get data?

  • Publicly repositories of research data sets

    • http://gesis.org (Archive for social sciences)
    • http://www.worldvaluessurvey.org/ (World Value Survey)
    • http://www.europeansocialsurvey.org/data/ (European Social Survey)
    • http://www.pewglobal.org/category/datasets/ (Pew Institute)
  • Other public repositories

    • https://github.com/awesomedata/awesome-public-datasets
    • http://www.kaggle.com
    • Many further online repositories… (you only need to find them!)
  • More data:

    • Your supervisor might also have data that suits your needs!
    • Some of the data sets used in class may be interesting to (re-)analyze (check out canvas!)

Where to get data?

  • Scraping primary sources

    • Press releases from party website (manually, or building a scraper)
    • Wikipedia articles (see scraping tutorial)
  • Proprietary texts from third parties:

    • digital archives (mediacloud, paperboy)
    • social media APIs (talk to your supervisors, but unfortunately, access is no longer easy!)
  • Your own social media data

    • You can collect your own whatsapp, tiktok, youtube, google data
    • Depending on the research question, this can be interesting too!

“Awesome” Data Sets

  • Check out this page: https://github.com/awesomedata/awesome-public-datasets

  • There are tons of great data sets worth exploring for text analysis purposes

Getting news articles with “mediacloud”

  • We can search for relevant news article URLs via the platform https://search.mediacloud.org/

Scraping with paperboy

  • Once we have relevant URLs, we can use the package paperboy to read the actual articles into R:
library(paperboy)

# Get urls from mediacloud
d <- read_csv("data/mediacloud_example.csv")

# Provide urls to this function
corp <- pb_deliver(d$url[1:4])

# Resulting text corpus
corp |> 
  select(domain, datetime, headline, text)
# A tibble: 4 × 4
  domain            datetime            headline                           text 
  <chr>             <dttm>              <chr>                              <chr>
1 amsterdamnews.net NA                  Storm Ciaran Whips Western Europe… "Voi…
2 nltimes.nl        NA                  About 100 Dutch climate activists… "Abo…
3 nrc.nl            2023-11-03 00:00:00 Wat vindt NRC | Omgang met AI zal… ""   
4 nu.nl             2023-11-02 15:20:54 Gaat klimaatverandering sneller d… "De …

Getting Text conversations with rwhatsapp

  • It is very easy to download a whatsapp conversation

  • We simply have to export the conversation

Getting Text conversations with rwhatsapp

  • Using the package rwhatsapp, we can easly read this into R to get an interesting corpus:
library(rwhatsapp)
chat <- rwa_read("data/_chat.txt") |> 
  select(-author)
chat
# A tibble: 45 × 5
   time                text                             source emoji  emoji_name
   <dttm>              <chr>                            <chr>  <list> <list>    
 1 2023-11-28 20:52:12 "‎Messages and calls are end-to-… data/… <NULL> <NULL>    
 2 2023-11-28 20:52:12 "‎You created group “Replication… data/… <NULL> <NULL>    
 3 2023-11-28 20:52:34 "‎image omitted"                  data/… <NULL> <NULL>    
 4 2023-11-28 20:55:05 "Major changes to the table in … data/… <NULL> <NULL>    
 5 2023-11-28 20:57:53 "That's all I can manage tonigh… data/… <chr>  <chr [1]> 
 6 2023-11-28 21:05:47 "Thanks and good to hear baby i… data/… <NULL> <NULL>    
 7 2023-11-29 10:12:05 "Looks good! I like it. A few n… data/… <NULL> <NULL>    
 8 2023-11-29 10:14:25 "But you even used the word \"g… data/… <NULL> <NULL>    
 9 2023-11-29 10:16:22 "Also I am not sure about the a… data/… <NULL> <NULL>    
10 2023-11-29 10:16:23 "See e.g., this paper's figure … data/… <NULL> <NULL>    
# ℹ 35 more rows

Important aspects

  1. Try to formulate an appropriate research question that can be studied with the respective data set, text documents, tweets,…

  2. Formulate hypotheses using theory and relevant literature

  3. If you combined text with survey data, test scales before using them!

  4. Engage in descriptive analyses

  5. Visualize data

  6. Test assumptions if necessary

  7. Put an emphasis on correctly reporting and interpreting your methods and results

Some ideas

Idea 1 (Political Communication)

  • Goal: Investigating news stance towards Dutch politicians before and after Elections

  • Method: Several different possibilities:

    • Scraping Dutch news articles via mediacloud and paperboy
    • Identifying politician per paragraph using dictionary approach
    • Classifying stance (sentiment) towards politician using Transformer models
    • Alternatively: Code ~1000 news paragraphs yourself and train a ML algorithm to detect sentiment
    • Test for differences in sentiment before vs. after the election

Idea 2 (corporate communication)

  • Goal: Create algorithm that can predict sentiment of financial news sufficiently well

  • Method: Comparing various supervised machine learning approaches and zero-shot learning

  • Data: https://www.kaggle.com/ankurzing/sentiment-analysis-for-financial-news

    • Use the data set to build various classifier and compare their performance
    • Scrape financial news from media cloud and paperboy
    • Use the classifier to predict sentiment
    • Compare with Atteveldt et al., 2018

Idea 3 (media psychology / political communication)

  • Goal: Detect linguistic bias in specific news paper articles

  • Method: using dictionary or zero-shot approaches to detect linguistic bias (e.g., gender-bias)

    • Scraping the news articles via mediacloud and paperboy
    • Build dictionary or classifier to detect biases
    • Test differences between newspapers (e.g. with different ideologies)

Idea 4 (political communication)

  • Goal: Topic modeling based on 18 years of Australian News Headlines: How did topics change over time?
  • Method: Zero-shot topic modelling with GPT or BERT
  • Data: https://www.kaggle.com/therohk/million-headlines

Idea 5 (Corporate Communication)

  • Goal: Investigating sentiment in Tweets/News coverage about a company before and after a crisis

  • Method: Manual coding of a subset, supervised machine learning afterwards or zero-shot learning

    • We might have some data available for some cases

Idea 6 (media psychology)

  • Goal: Does chatGPT reproduce biases and stereotypes?

  • Method: Prompt GPT to write stories or headlines, gather output and text analyze these for stereotypes or biases

    • Create prompts that GPT might intepret in certain ways
    • Prompt GPT systematically
    • Collect output and classify them using a BERT model (?)
    • Test for systematic bias or stereotyping

Idea 7

  • Goal: Use of emotions (or emojis) in whatsapp conversations

  • Method: Classifying emotions in whatsapp conversation (would require a bit more than just your own)

    • Export whatsapp conversations and import into R with rwhatsapp
    • Classify emotions / extract emojis and show differences in personalities, language use
    • Alternatively use word-embeddings to compare similarity in language use across users/conversations…

Other ideas

  • Analyzing your own data

    • You can easily export your netflix use data, spotify use data, google maps location data, your browser history and many more “trace” data
    • Although the amount of individuals you can get data on my be limited, the data is nonetheless quite rich and can be interesting to analyze/explore
    • The challenge will be to find a good research question!
  • Going beyond text analysis

    • You also learned a lot about data wrangling and visualization in this course

    • You can also use this knowledge and engage in other type of data analyses

    • e.g., using world value survey data to show trends in values over time and across countries; secondary analyses of large-scale survey data (Pew Research, Gesis…)

Further questions?

Thank you for your attention!