![[Deprecated]](figures/lifecycle-deprecated.svg) This function is deprecated because the new version of specr uses a new analytic framework.
In this framework, you can plot a similar figure simply by using the generic
This function is deprecated because the new version of specr uses a new analytic framework.
In this framework, you can plot a similar figure simply by using the generic plot().
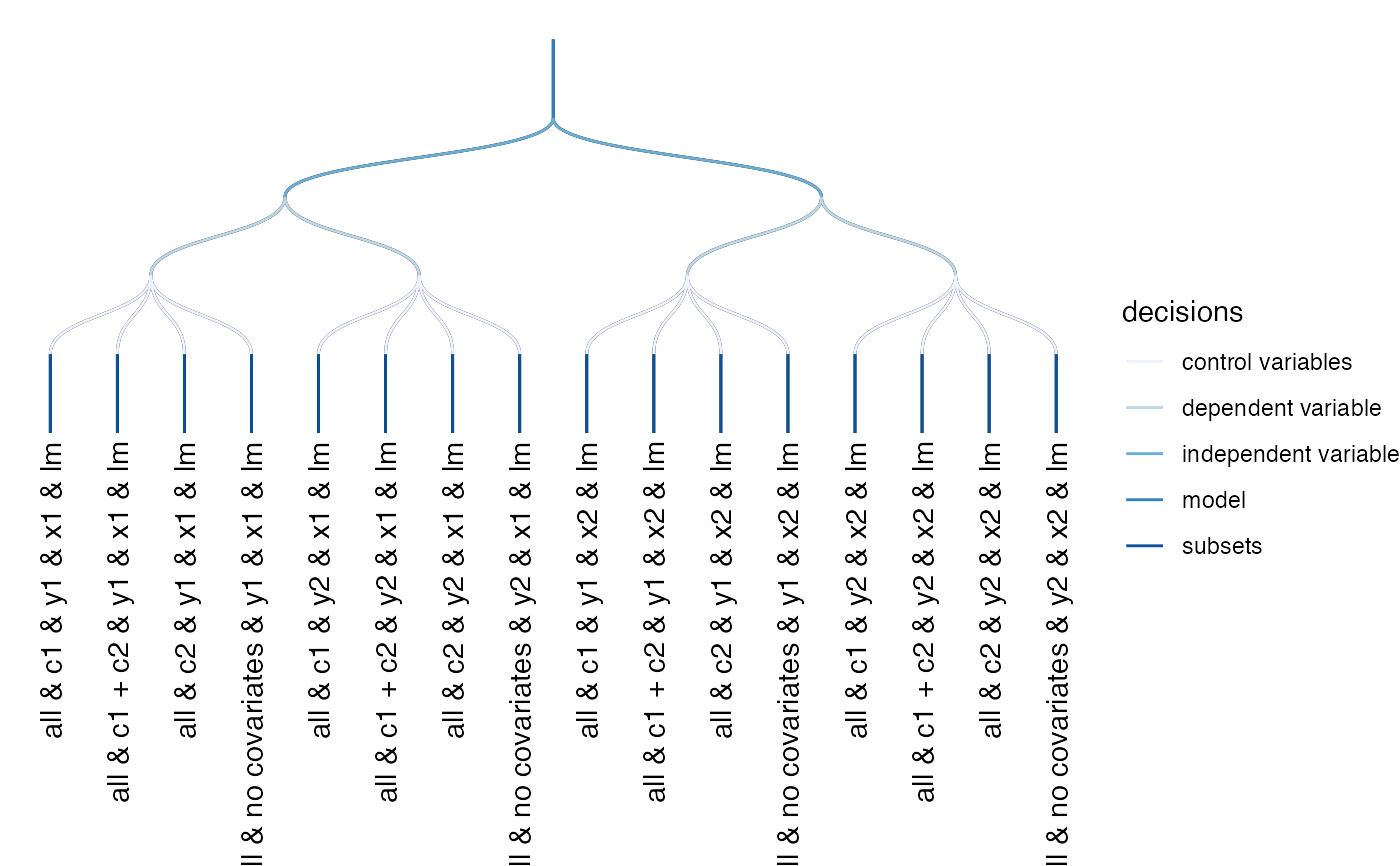
This function plots a simple decision tree that is meant to help understanding how few analytical choices may results in a large number of specifications. It is somewhat useless if the final number of specifications is very high.
plot_decisiontree(df, label = FALSE, legend = FALSE)Arguments
- df
data frame resulting from
run_specs().- label
Logical. Should labels be included? Defaults to FALSE. Produces only a reasonable plot if number of specifications is low.
- legend
Logical. Should specific decisions be identifiable. Defaults to FALSE.
Value
a ggplot object.
Examples
results <- run_specs(df = example_data,
y = c("y1", "y2"),
x = c("x1", "x2"),
model = c("lm"),
controls = c("c1", "c2"))
# Basic, non-labelled decisions tree
plot_decisiontree(results)
#> Warning: `plot_decisiontree()` was deprecated in specr 1.0.0.
#> ℹ Please use `plot.specr.setup()` instead.
 # Labelled decisions tree
plot_decisiontree(results, label = TRUE)
# Labelled decisions tree
plot_decisiontree(results, label = TRUE)
 # Add legend
plot_decisiontree(results, label = TRUE, legend = TRUE)
# Add legend
plot_decisiontree(results, label = TRUE, legend = TRUE)