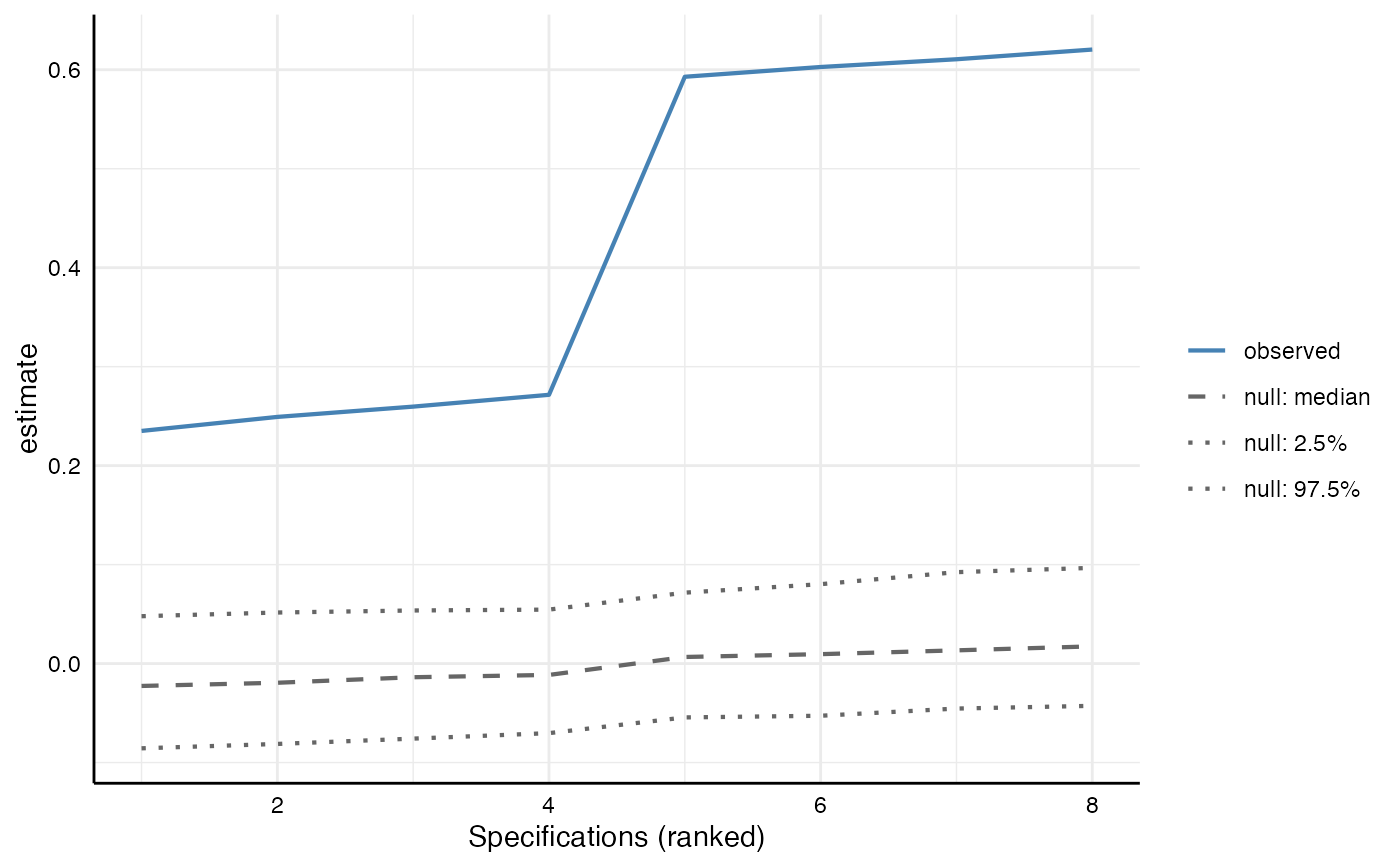
This function plots the observed specification curve (estimates
ranked from lowest to highest) on top of the median and the 2.5% and 97.5%
quantiles of the ranked curves under the null (resulting from infer_curve()).
Usage
# S3 method for class 'specr.infer'
plot(x, ...)
Arguments
- x
A
specr.inferobject, resulting from callinginfer_curve().- ...
further arguments passed to or from other methods (currently ignored).
Value
A ggplot object that can be customized further.